

Data study
Do forex robots actually work? What 700,000 backtests show
 Tommy JayFounder, RoboticEA
“Does this robot work?” is a question about evidence, not about software, so we answered it with our own engine: 738,615 backtests across four separate studies — 594,580 runs on EURUSD, 88,770 on XAUUSD, 6,625 across 25 instruments, and 48,640 spent specifically on the question of whether a strategy that looks good keeps looking good somewhere else. Every run on real recorded market bars, with the spread charged inside the simulation.
The short answer
The honest answer
Do forex robots work?
Two things are true at once, and almost every page on this subject picks one and hides the other.
The first: rules-based trading is not a fraud. A strategy is just a specification — these conditions, that stop, this position size — and specifications can be tested. In our largest sample, all 822 strategies in the top 1% by in-sample return finished the 6 years in profit, and 61.3% of them made money in at least 4 of those 6 years individually. Those are real runs on real bars, and their median worst drawdown — -40.1% — is real too.
The second: the population they were drawn from is a graveyard. The median strategy in the same sample lost -36.1% in a typical year, compounding to -92.5% over the six, with a median maximum drawdown of -52.1% per year. Only 16.7% of all 509,640 yearly results were positive.
So “do forex robots work?” resolves into a much more useful question: can you tell, in advance, which one you are holding? That is a question about the test, not about the robot — and it is the question the rest of this page is about.
3.8%
of strategies finished 6 years in profit
82,170 strategies that took at least one trade, each backtested separately on every year from 2020 to 2025 on EURUSD H1 with the real recorded spread charged. 15.9% lost at least 95% of the account in at least one of those years. Seed 20260808, 0 failed runs.
Method
What we measured, and how
Four studies, run at different times for different reasons, which is why they can be read against each other rather than as one narrative.
| Study | Runs | What it is | Reported here as |
|---|---|---|---|
| Archetype studyEURUSD H1, 34 archetypes, 5 risk levels | 594,580 | 84,940 random-setting strategies, each backtested independently on 6 full years | the distribution |
| Gold studyXAUUSD, 8 full years, 3 cost models | 88,770 | 1,966 strategies × 8 years, then the identical cells again under cheaper cost assumptions | what costs hide |
| Instrument matrix25 symbols, 2023 | 6,625 | 265 strategies run on every one of 25 instruments | it is not one pair |
| Selection holdoutsinstrument holdout + time holdout | 48,640 | top-ranked strategies moved to instruments and years they were never selected on | why picking fails |
The strategies are not curated. In the archetype study the settings are generated, 5 fixed risk levels per base specification and 2,500 specifications per archetype — the point is to measure the population a robot is drawn from, not to showcase a winner. That makes the headline numbers pessimistic by construction, and we will separate the population result from the best-of result rather than blur them.
- One year at a time.Each year is an independent backtest from the same starting balance. “Profitable in 4 of 6 years” is a claim a single compounded curve cannot make, in either direction.
- Costs charged as the trade happens. Spread, commission and overnight swap are paid inside the simulation, not deducted from the result afterwards.
- Failures counted, not dropped. 0 failed runs in the archetype study, 0 in the gold study, 0 hard failures across the 6,625-run matrix. A study that quietly discards its failures is reporting a survivor.
- Idle strategies flagged, not averaged in. 3.26% of the archetype sample never took a trade at all, and a strategy that never fires returns exactly zero — which ranks above the median in a losing population. Every ranking here is denominated on the strategies that traded.
The distribution
What a random robot actually does
This is the number nobody publishes, because there is no product in it. 509,640 yearly backtests, 84,940 strategies, one instrument, one timeframe:
-36.1%
median year
16.7%
of years positive
-52.1%
median max drawdown, per year
+29.4%
95th-percentile year
Read both ends. One year in twenty, a strategy from this population returned +29.4% or better — that is the screenshot you are shown. The median year in the same population was -36.1%, and 15.9% of strategies had at least one year in which they lost 95% or more of the account. The single best compounded result in the study was +1473%; the median was -92.5%.
A distribution this wide is precisely what makes a single backtest uninformative. If one in six yearly results is positive by chance, then showing you one positive year — or one cherry-picked window of them — costs a vendor nothing at all.
| Year | Median return | Strategies positive | Median trades |
|---|---|---|---|
| 2020 | -32.7% | 23.3% | 163 |
| 2021 | -40.3% | 12.4% | 164 |
| 2022 | -36.2% | 14.1% | 164 |
| 2023 | -30.3% | 18.1% | 165 |
| 2024 | -48.2% | 9.2% | 173 |
| 2025 | -27.4% | 23.3% | 160 |
| 2026 (partial) | -9.9% | 35.1% | 76 |
Fairness
How much of that damage is just the risk setting?
A fair question, and one we can answer exactly, because the same base specifications were run at 5 fixed risk levels from 2% to 5% of the account per trade. 16,434 bases appear in both the lowest and the highest arm, so the comparison is paired.
| Risk per trade | Median 6-yr return | Median max DD | Ruined | Profitable |
|---|---|---|---|---|
| 2.00% | -74.8% | -34.3% | 8.2% | 4.8% |
| 2.75% | -86.3% | -44.5% | 11.4% | 4.2% |
| 3.50% | -93.2% | -53.1% | 15.4% | 3.7% |
| 4.25% | -96.7% | -60.6% | 20.0% | 3.3% |
| 5.00% | -98.4% | -67.0% | 24.7% | 3.0% |
So yes: part of the carnage above is aggression, not absence of edge. At 2% per trade the median result is -74.8% with 8.2% ruined; at 5% it is -98.4% with 24.7% ruined. But notice what does not change: even at the gentlest setting, only 4.8% of strategies finished the 6 years in profit. Lower risk buys survival, not an edge.
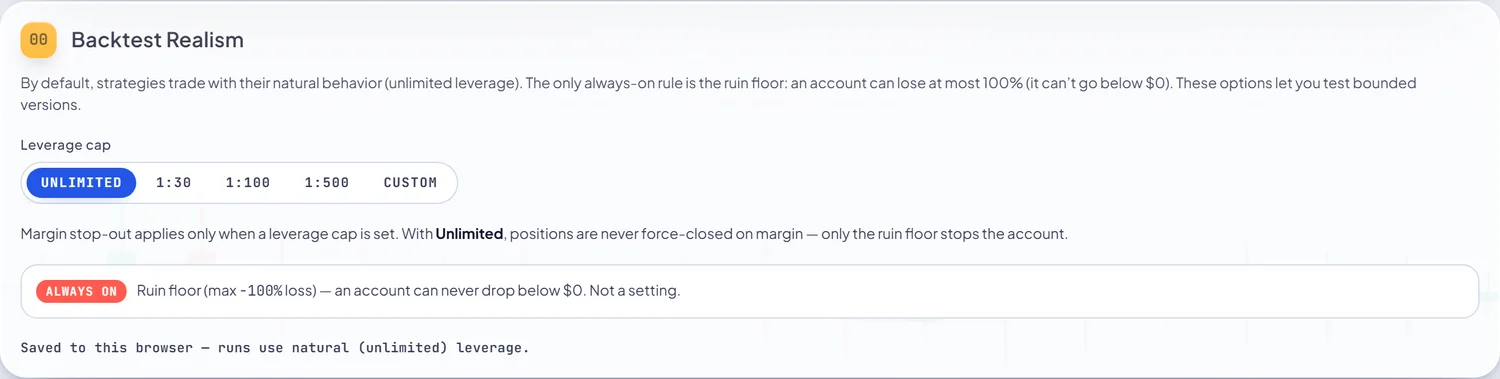
The best of them
The top 1% look magnificent
Now the other half of the honest answer. The median tells you what a random robot does; a product ships the best one it can find. Those are different questions, and the same data answers both — so here is the same population sliced by its own in-sample rank.
All 822 strategies in that top row finished the 6 years in profit — 100% of them — at a median compounded +63.7%, and 61.3% made money in at least 4 of the 6 years individually. If we wanted to sell you a robot, we would show you that row, put a smoothed curve under it, and never mention the -40.1% median drawdown beside it — still less the 82,170 strategies it was chosen from.
Which brings us to the only question that matters about a top-ranked strategy: is the ranking real, or is it a record of what happened to fit?
The core finding
…and the ranking does not travel
We tested this directly, and it is the most uncomfortable result we hold. Take the top 25strategies by in-sample return — all of them scale-free, using ATR-based stops and percentage-of-account sizing, so nothing about them is tied to one instrument’s units — and run each on 12 instruments.
| Timeframe | On its home instrument | Transplanted | 95% interval | Rank transfer ρ |
|---|---|---|---|---|
| H4 | +5.34% | -4.09% | -4.82% … -3.04% | 0.059 |
| H1 | +15.25% | -18.27% | -19.21% … -14.27% | 0.210 |
| D1 | +1.97% | -0.96% | -1.21% … -0.62% | -0.041 |
+15.3% → -18.3%
the same top-ranked strategies, at home and on instruments they were not chosen on
H1, top 25 by in-sample return, transplanted across 12 instruments (95% interval -19.21% to -14.27%). Rank correlation between instrument pairs: ρ = 0.210 over 28 pairs. Nothing about the strategies changed.
The tell is sharper still. USDJPY was the only instrument on which the top-25 made money — and it was home to 11 of 25 (H4) and 16 of 25 (H1) of them. Split those cells and the illusion falls apart: strategies whose home was that pair returned +15.80% on H1, while strategies transplanted onto it returned -26.29%. The instrument has no edge. The strategies fitted on it have an edge there, and nowhere else.
The same thing happens when you move the years instead
A second design, sharing nothing with the first: 200 strategies run on the same two instruments so nobody has a home advantage, the top 10 picked by in-sample return, then those same ten scored on years they were never selected on — averaged over 4 splits.
| Cell | In-sample top-10 | In-sample max DD | Same 10, unseen years |
|---|---|---|---|
| H4 GBPUSD | +4.31% | -9.16% | -6.43% |
| H4 EURUSD | +11.20% | -15.95% | +1.43% |
| H1 GBPUSD | +8.40% | -31.65% | -20.16% |
| H1 EURUSD | +40.70% | -37.46% | -26.26% |
+40.70% in sample became -26.26% out of it. And a warning about how easily this work fools the person doing it, recorded in the same study: One split of four pointed the opposite way to the other three and would have been reported as a finding on its own. One split is not a holdout.
This is the mechanism behind almost every disappointing robot. It is not usually fraud, and it is not usually a bug. It is that the strategy was selected on the same data it is being advertised with, and selection on a wide distribution finds the luckiest sample rather than the best rule.
Run the test that vendors skip
Every strategy in RoboticEA is re-run on each year separately, with real recorded spread, and the losing years are shown to you. Free account, no card, MetaTrader 5 export included.
The cost model
Where vendor backtests get their profit
The second big gap between an advertised curve and a live account is friction, and this one we can demonstrate rather than assert. We took 1,966 strategies on XAUUSD, ran each of the 8 full years from 2018 to 2025 as a separate backtest, then re-ran the identical 15,728 cells under two cheaper cost assumptions. Nothing changes except what the trade is charged.
| Cost model | Median year | Years positive | Median max DD | Profitable all 8 |
|---|---|---|---|---|
| Real recorded spreadthe instrument’s own per-bar spread + commission + swap | -38.5% | 17.4% | -54.5% | 0 |
| Flat 1 pipthe “realistic retail” approximation | -21.3% | 25.9% | -46.5% | 0 |
| Zero costfrictionless | -6.1% | 40.6% | -41.5% | 10 |
10 → 0
strategies "profitable every year for 8 years", with costs off and on
Switch friction off and 10 strategies appear with a flawless 8-year record — exactly the artefact a vendor page is built from. Charge the real recorded spread on the same runs and there are none. Same strategies, same years, same engine.
Per cell, understating the spread as a flat pip flattered the result by a median of +9.1 pts a year, and 1,356 cells — 8.6% of them — were profitable only because of that assumption. Remove friction altogether and 3,658 cells (23.3%) flip to a profit they never earned.
Across 1,966 strategies and 8 years, 0 were profitable in every year with real costs charged; 2 managed 7 of 8, a sample far too thin to conclude anything from — which is itself the point. The full breakdown, plus what survived and why, is in the gold EA study.

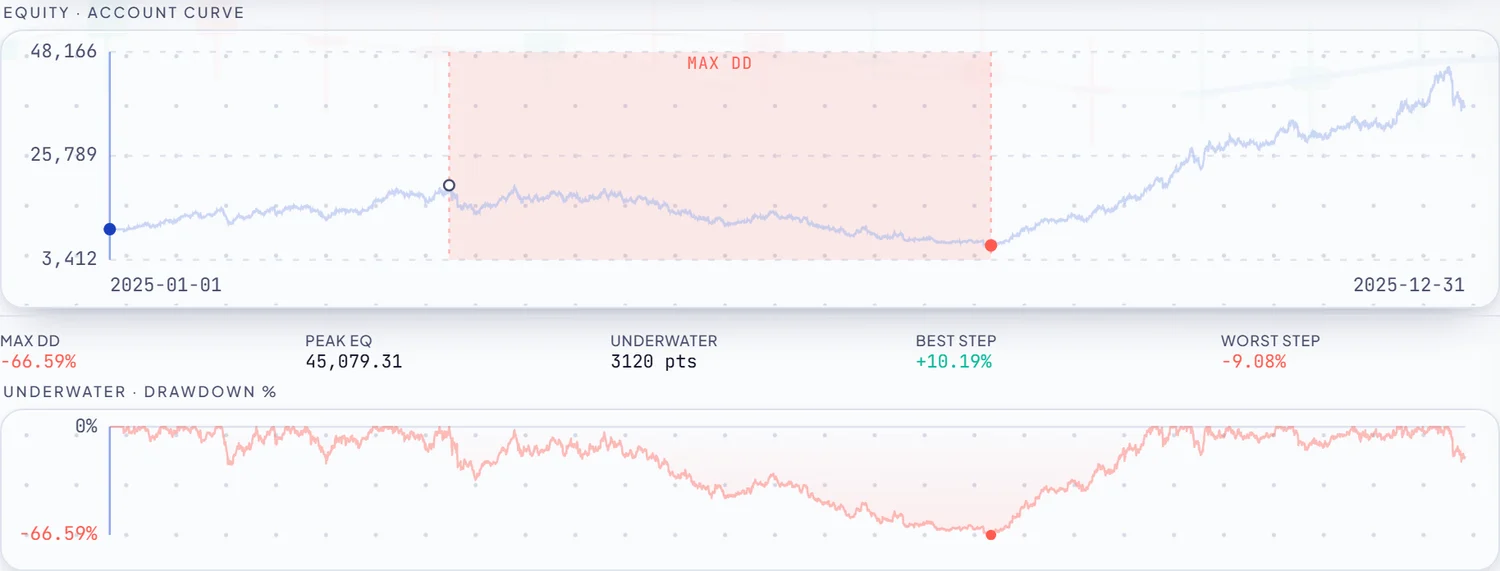
Breadth
It is not one pair’s fault
A reasonable objection to everything above: maybe we picked hostile instruments. So here is the widest sweep we hold — 265 strategies run on every one of 25 instruments — majors, crosses, yen crosses, equity indices and gold — 6,625 runs with 0 hard failures and 89.4% of completed runs taking at least one trade.
| Instrument class | Symbols | Runs that traded | Runs positive |
|---|---|---|---|
| metal | 1 | 252 | 29.0% |
| JPY cross | 5 | 1,151 | 26.5% |
| index | 7 | 1,733 | 21.6% |
| FX major | 7 | 1,618 | 20.6% |
| FX cross | 5 | 1,167 | 16.2% |
0 of 25
instruments where more than half of the strategies made money
Best was JP225 at 41.8% of its 239 runs positive; worst was EURCHF at 6.8%. One year only (2023), so treat the ordering as an illustration of spread rather than a ranking.
Note the range: the same 265 strategies went from 6.8% positive on EURCHF to 41.8% on JP225 — a 6.1-fold difference produced entirely by the choice of instrument. That is the same effect as the transplant result seen from the other side, and it is why “this EA made a fortune last year” is a statement about a market as much as about a robot. Which pairs behave best, and why, is its own study: the best forex pairs for expert advisors.
The constructive part
So what does work?
Not a robot. A test. Everything in this post points at the same conclusion: the strategy is cheap and the evidence is expensive, so spend your effort on the evidence. In practice that means four things, all of which our own numbers argue for.
- Per-year results, never one compounded curve. The years you choose swing the answer from 9.2% of strategies positive to 23.3%. A row of years with the losses left in cannot be window-shopped.
- Out-of-sample by instrument as well as by time. The transplant result is the whole reason: an in-sample top-N is substantially a list of which instrument suited the window. And run at least four splits — one of ours pointed the wrong way.
- Real recorded costs, charged inside the run. 23.3% of cells changed sign in our cost experiment. If you do not know what spread was charged, you do not know the result.
- Drawdown and trade count beside every return. A strategy that took a handful of trades has no record, however pretty; a return without its drawdown is half a number. Our median strategy took 165 trades a year, which is what makes its yearly result mean anything at all.
This is what an honest record looks like when you do that — a real strategy in our app, not a sales page:
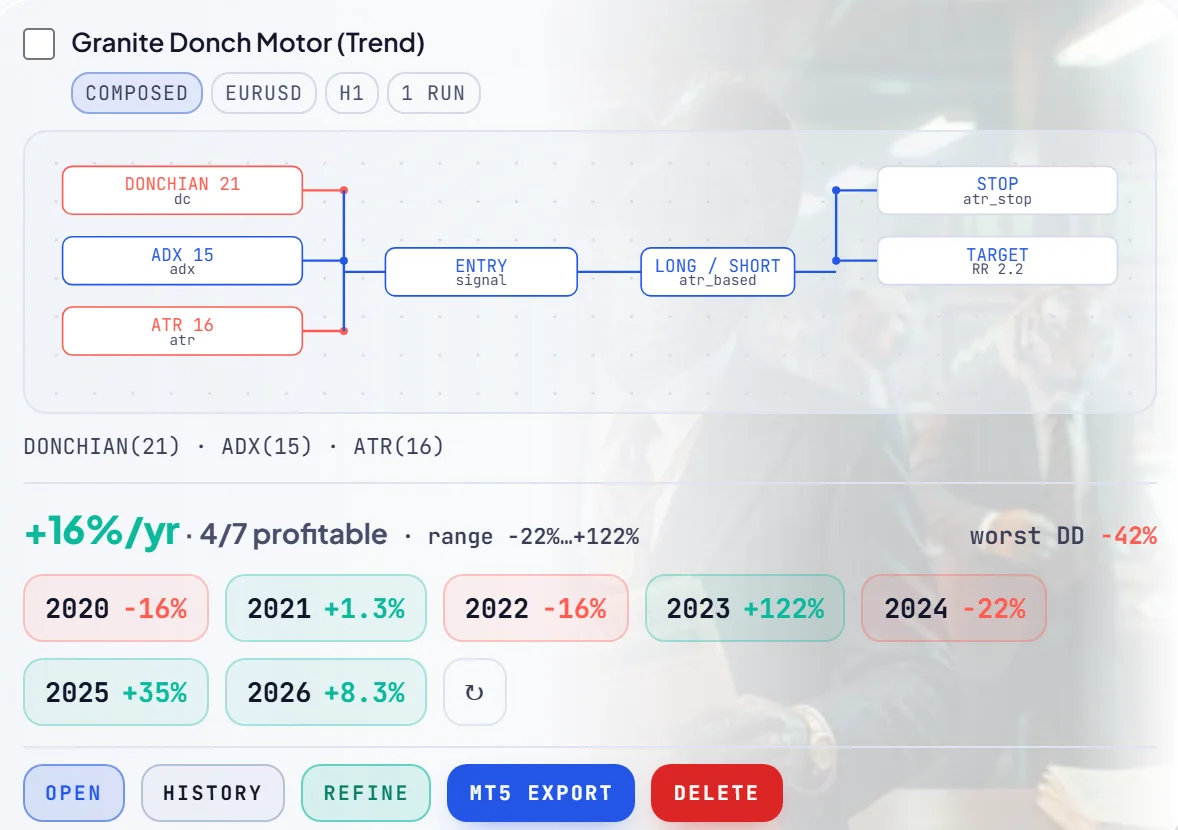
The judgement is deliberately awkward. A strategy that made money in four years of seven, while spending one of them more than 40% below its high-water mark, is not a product you would advertise; it is a result you can reason about. That is the trade this software makes — and it is why our own studies read like a list of things that failed, because most of them did.
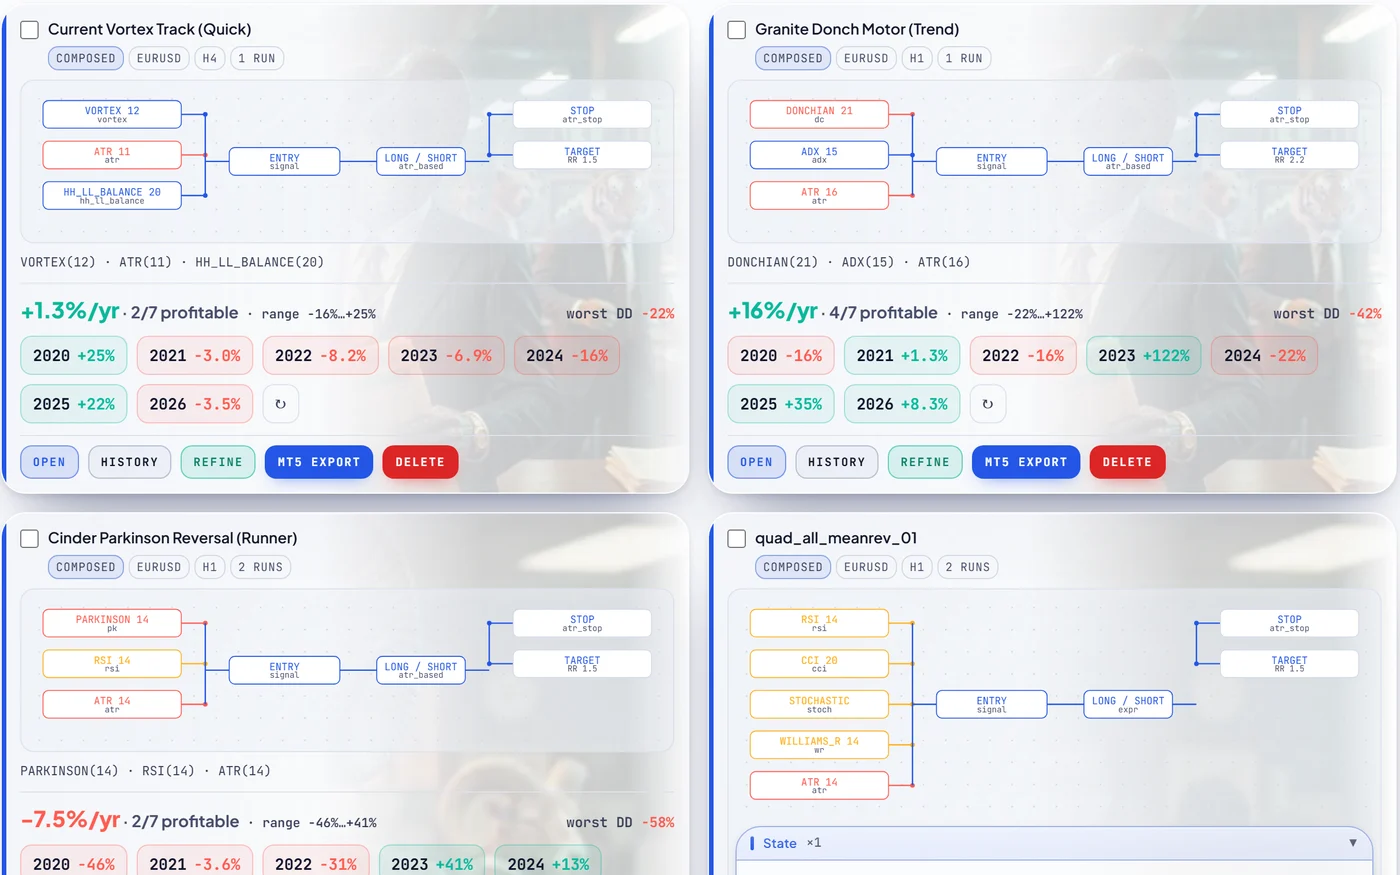
And one prior question, since all of this rests on it: our engine has been run head-to-head against MetaTrader 5’s own Strategy Tester on real ticks, because a simulator that disagrees with the platform you would actually deploy on cannot settle any of these arguments. That work is written up in the parity study.
Limits
What we still do not know
We have not solved strategy selection, and it would be dishonest to imply the numbers above say otherwise. Specifically:
- Every figure on this page is a simulation. We hold no live trading record. Backtests contain no information about the future, and a strategy that cleared costs for six years can lose money from the day it is deployed.
- The instrument holdout is one study. 48,640 runs, 12 instruments, 3 timeframes. It shows that ranking by in-sample return does not transfer. It does not show that no selection method transfers — a claim we have not earned and are not making.
- Our best-of numbers are still in-sample. The top-slice figures come from the 594,580-run study, which has no instrument holdout of its own. We have not re-run that population through a transplant, and until we do, treat its top rows as an upper bound rather than a forecast.
- The matrix is a single year. 2023 only, one run per strategy-instrument pair, and drawdown was not recorded per run — which is why nothing but shares is reported from it.
- One instrument, one timeframe for the big distribution. The archetype study is EURUSD H1 with generated settings at 2%–5% risk. A curated, hand-tuned, lower-risk population would very likely look better; we have not measured how much.
- What actually improves selection is open. Walk-forward refitting, parameter-neighbourhood stability and portfolio construction are all plausible answers we have not yet measured at this scale. When we do, the results will be published the same way — including if they fail.
Practical
How to test any robot you are offered
You do not need our software for this. Seven questions, ordered so the cheapest eliminations come first — the first two are the ones our own data says decide most of it.
- What spread and commission were charged? If the answer is not a number, stop. In our paired experiment this single assumption moved 23.3% of results across the profit line.
- Show me every year separately, losers included. Not a compounded curve. Ask for the worst year by name.
- What is the maximum drawdown, next to the return? The median strategy-year in our sample drew down -52.1%. A robot quoting a return without a drawdown is quoting half a result.
- How many trades per year?Under about 20 and the record is noise. Several of the most “consistent” strategies in our gold study were consistent only because they barely traded.
- Was it tested on instruments or years it was not chosen on? This is the question that separates a measurement from a memory. Expect a straight answer or none.
- What risk per trade produced that curve? At 5% per trade, 24.7% of our strategies lost 95% or more of the account in at least one year, against 8.2% at 2%. A big return at a big risk setting is not an edge.
- Can I read the source? If the robot arrives as a compiled
.ex5you cannot inspect, you are trusting the seller’s backtest and nothing else. Our guide to free MT5 expert advisors goes through this in more detail.
A robot that answers all seven may still lose money — that is the nature of the thing. But a robot that answers none is not a strategy, it is a screenshot.
FAQ
Questions, answered
Do forex robots actually work?
Some do; most do not, and a single backtest cannot tell you which you are holding. Of 82,170 strategies that traded in our largest study, 3.8% finished the six years from 2020 to 2025 in profit, and 15.9% lost 95% or more of the account in at least one of those years. The median strategy-year returned -36.1% with a -52.1% maximum drawdown. At the other end, all 822 strategies in the top 1% by in-sample return finished the six years in profit, at a median of +63.7% — with a -40.1% median worst-year drawdown. Rules-based trading works. Identifying which specific robot works is the hard part.
Are expert advisors profitable?
As a population, no. Only 16.7% of 509,640 individual yearly backtests were positive, and the median strategy compounded to -92.5% over six years. Risk settings make it worse rather than better: raising risk per trade from 2% to 5% moved the median paired strategy by -17.7 percentage points and made 94.0% of them worse, while the share that lost 95% or more of the account rose from 8.2% to 24.7%. Profitability is a property of one specific, tested strategy, not of expert advisors as a category.
Are forex robots a scam?
Usually it is not fraud — it is selection and cost modelling, both of which we can measure. We re-ran 16,400 XAUUSD backtests with the trading costs switched off: 4,314 cells, 26.3% of them, turned profitable purely because of the cheaper assumption, and 12 strategies appeared with a flawless eight-year record where the real recorded spread produces none at all. Nothing about the strategies changed. A backtest that does not state the spread it charged is not evidence.
Why do EA backtests look so much better than live results?
Two measured reasons. First, costs: understating gold's spread as a flat one pip flattered results by a median of 6.5 percentage points a year and made 10.6% of runs profitable that otherwise were not. Second, in-sample selection: we took the top 25 strategies by in-sample return and ran them on 12 instruments, and H1 results went from +15.25% at home to -18.27% transplanted, with rank correlation between instrument pairs of just 0.210 over 28 pairs. A top-10 selection that returned +40.70% in sample, with a -37.46% drawdown, averaged -26.26% on years it was not chosen on.
Can you make money with expert advisors?
It is possible, but the evidence bar is much higher than a vendor curve. In our sample the strategies that cleared costs across six consecutive years existed — 3.8% of the population — and even the best 1% carried a -40.1% median worst-year drawdown. We hold no live trading record: every figure we publish is a historical simulation, and a strategy that cleared costs for six years can lose money from the day it is deployed. Anyone claiming otherwise is selling certainty that does not exist.
Do trading bots work better on some currency pairs than others?
The instrument matters enormously, which is part of the problem. We ran 265 strategies on all 25 instruments we hold data for in 2023: 21.6% of runs that traded finished positive, ranging from 6.8% on EURCHF to 41.8% on JP225 — a six-fold difference produced entirely by the choice of instrument. But no instrument was actually good: zero of the 25 had more than half of its strategies making money. That is one year only, with drawdown not recorded per run, so treat the ordering as an illustration rather than a ranking.
How can I tell whether an EA is worth testing?
Ask seven questions, cheapest first. What spread and commission were charged, in numbers? Show me every year separately with the losers included. What is the maximum drawdown, next to the return? How many trades per year — under about 20 and the record is noise. Was it tested on instruments or years it was not selected on? What risk per trade produced that curve? And can I read the source, or is it a compiled file I have to trust? A robot that answers all seven may still lose money. A robot that answers none is a screenshot, not a strategy.
Every number above is reproducible from an artifact in this repository: 594,580 runs on EURUSD (seed 20260808), 88,770 on XAUUSD (engine build 0.2.0, seed 20260817), 6,625 across 25 instruments, and 48,640 on the selection holdouts. The instruments, timeframes and years are all in the product, so you can re-run the parts you doubt — here is how the workflow fits together.
Keep reading
594,580 backtests across 34 archetypes
The full distribution behind this post: best, worst, most consistent, most likely to blow up, and what more risk really costs.
Is there a best gold expert advisor?
The 88,770-run XAUUSD study, including the cost experiment quoted above and the five strategies that survived.
Which timeframe should an EA trade?
The dimension that turned out to move results more than strategy choice does — measured per timeframe.
Does our engine agree with MetaTrader 5?
Run for run against MT5's own Strategy Tester on real ticks. If the simulator is wrong, none of the above counts.
How the per-year validation works
Why every strategy is re-run on each year separately, and what the grid is actually telling you.
Test a strategy yourself
Free account, no card. Generate, backtest per year with real recorded spread, and export readable MQL5.