

Data study
Best forex pairs for expert advisors: all 25 instruments tested
 Tommy JayFounder, RoboticEA
Every “best pair for a forex robot” list you will find is somebody’s opinion about which chart trends nicely. We ship 25 instruments and can test all of them identically, so we did: the same 180 strategies run on every one of them, each of the 8 full years from 2018 to 2025 as its own backtest, with each instrument’s real recorded spread charged inside the simulation — then the identical cells again with no costs at all, to isolate what the friction is doing. 73,250 runs, 0 failures.
The short answer
The honest answer
Is there a best forex pair for an expert advisor?
Not in the sense the question is usually asked. The premise is that some instruments are friendlier to automation than others, and that if you find the friendly one your strategy will work on it. What the data shows is a much duller and much more useful thing: the instrument decides how much a strategy has to earn before it breaks even, and that number varies by more than an order of magnitude across the 25 we ship.
+2.6% → -5.6%
the strategies chosen as an instrument's best, then moved to the other instruments
Top 3 per timeframe on each of the 25 instruments, selected using that instrument's own 8-year record — the in-sample selection every leaderboard performs — then the same strategies scored on the other 24. H1 and H4 strategies trading at least 20 times every year. Engine build 0.2.0, real recorded spread.
That gap is why this post has no leaderboard of pairs at the top. A ranking of instruments built from strategy returns is mostly a ranking of which instrument each strategy happened to suit — a trap this repository has already walked into and written up. So everything below reports instruments as cost and tradability characteristics: what the spread takes, what a lot is worth, what a $10,000 account can actually size, how often the engine had to refuse an entry. Those properties are stable. Rankings are not.
Method
What we tested, and how
The strategy sample is the one the gold study drew, subsampled per timeframe: 15 M5, 35 M15, 25 M30, 60 H1, 45 H4. Stratifying matters more than it sounds — our preset library is about 62% H1, so a uniform sample would have made this a statement about the library’s composition dressed up as one about instruments.
- Only the symbol changes. Each strategy keeps its own timeframe, its own risk per trade and its own parameters; we rewrite the instrument and nothing else. A strategy spec in this product is symbol-agnostic — the instrument, timeframe, window and cost model are supplied to it separately — so this is exactly the substitution the app performs when you re-run a saved strategy on a different symbol.
- One year at a time. Every year is an independent backtest from $10,000, because a single compounded figure over eight years cannot tell you how often an instrument was survivable.
- Real recorded spread, charged inside the simulation.Not an estimate applied afterwards — the instrument’s own per-bar spread, plus commission and overnight financing, as the trade happens. For the 8 indices and metals this is the only defensible model, and the app offers no other; it is the default on every run regardless of instrument.
- The same cells again at zero cost. Matched cell for cell, so the only thing that differs is what the trade was charged. The difference is the friction bill, and it is the one cost measure that is comparable across instruments.
- Daily bars kept separate. D1 (50 strategies) runs one wide 2018–2025 window rather than eight one-year windows, and is reported on its own. A calendar year is only about 260 daily bars; a previous instrument sweep used a six-month window and produced ten “dead” strategies, eight of which turned out to be merely starved of bars.
- 73,250 runs, 0 failures, one engine build (0.2.0), every run asserted to be on real market bars (rbar, rbar-m5) — because an engine given no data will quietly invent it.
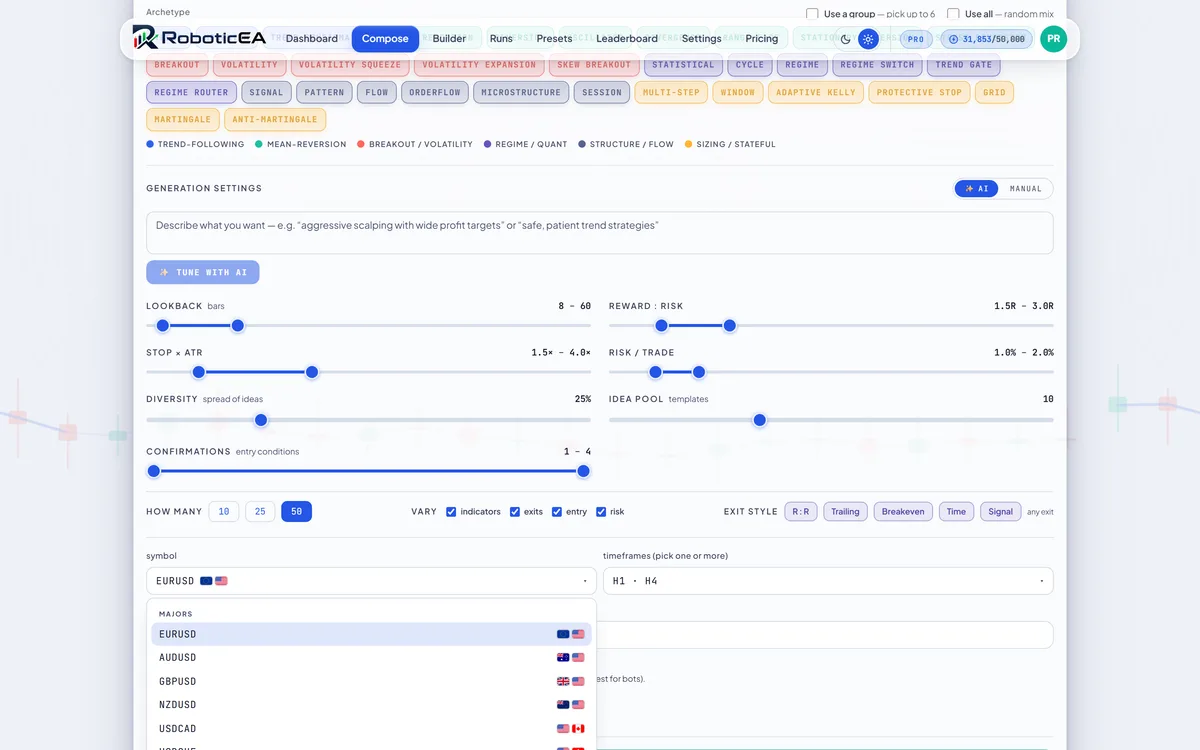
One limitation stated plainly, because it cuts the same way for every instrument: these are general-purpose strategies pointed at each symbol, not strategies tuned on it. That is deliberate — it is what happens when you attach a downloaded EA to a new chart — but it measures how an instrument treats an outside strategy rather than how well a strategy can be fitted to an instrument’s past.
The friction bill
What each instrument charges a strategy
This is the result that matters most and it is the one no “best pairs” article contains. Each bar is the median gap, per year, between a strategy’s result with that instrument’s real spread charged and its result with no costs at all — the same strategies, the same years, matched cell for cell. Read it as the percentage of the account the instrument takes before the strategy has done anything.
AUDNZD charges the most, at 22.3 pp of the account a year; US30 the least, at 5.8 pp — a factor of about 3.8 between the two ends of the same list of tradable instruments. Note what is at each end: US30 is an index and AUDNZD is a FX cross, which is not the ordering the folklore about “liquid majors” predicts. It is arithmetic rather than folklore: the spread is a property of the instrument; how many times a year you pay it is a property of your strategy, and the bill is the product of the two.
11.5 pp
EURUSD friction, per year (median 157 trades)
12.0 pp
XAUUSD friction, per year (median 150 trades)
28.5%
of AUDNZD results that are profitable only if you forget the spread
21.0%
the same figure on EURUSD
That third figure is the practical one. On AUDNZD, 28.5% of strategy-years were profitable only in the zero-cost arm — they never earned that money, the cost model gave it to them. On EURUSD the same measure is 21.0%. If you are handed a backtest on an expensive instrument and the spread assumption is not stated, that is the share of the result you should assume is missing.
| Class | Symbols | Cost / yr | Median year | Median DD | Years positive |
|---|---|---|---|---|---|
| FX major | 6 | 14.8 pp | -20.0% | -29.0% | 16.5% |
| FX cross | 5 | 18.0 pp | -26.5% | -33.5% | 11.7% |
| JPY cross | 6 | 12.8 pp | -13.2% | -25.7% | 23.4% |
| index | 7 | 8.9 pp | -11.8% | -24.4% | 24.0% |
| metal | 1 | 12.0 pp | -15.8% | -26.7% | 20.4% |
The class ordering is the more robust version of the same point, because it does not hinge on any one symbol. The cheapest class to trade in this sample was index at 8.9 pp a year and the dearest was FX cross at 18.0 pp, and the return and drawdown columns move with the cost column rather than against it. That is the whole finding in one table: the instruments that treat a strategy best are the ones that charge it least.
Contract economics
What a “pip” is actually worth
Behind the cost table sits a layer most EA discussions skip entirely. A pip is not a unit of money, it is a unit of price, and what it is worth depends on the contract size and the currency the instrument is quoted in. The figures below are not measured — they are read directly out of the engine’s own contract table in make_symbol(), so they are exactly the arithmetic every result on this page was computed with.
| Symbol | Quote | $ / pip / lot | Lots for 1% risk on $10k | Max order |
|---|---|---|---|---|
| EURGBP | GBP | $12.66 | 0.26 | 100 |
| EURCHF | CHF | $11.36 | 0.29 | 100 |
| USDCHF | CHF | $11.36 | 0.29 | 100 |
| AUDUSD | USD | $10.00 | 0.33 | 100 |
| EURUSD | USD | $10.00 | 0.33 | 100 |
| GBPUSD | USD | $10.00 | 0.33 | 100 |
| NZDUSD | USD | $10.00 | 0.33 | 100 |
| XAUUSD | USD | $10.00 | 0.10 | 100 |
| USDCAD | CAD | $7.30 | 0.46 | 100 |
| AUDJPY | JPY | $6.67 | 0.50 | 100 |
| CADJPY | JPY | $6.67 | 0.50 | 100 |
| EURJPY | JPY | $6.67 | 0.50 | 100 |
| GBPJPY | JPY | $6.67 | 0.50 | 100 |
| NZDJPY | JPY | $6.67 | 0.50 | 100 |
| USDJPY | JPY | $6.67 | 0.50 | 100 |
| EURAUD | AUD | $6.58 | 0.51 | 100 |
| GBPAUD | AUD | $6.58 | 0.51 | 100 |
| AUDNZD | NZD | $5.99 | 0.56 | 100 |
| UK100 | GBP | $1.27 | 2.63 | 250 |
| DE40 | EUR | $1.08 | 3.10 | 250 |
| US100 | USD | $1.00 | 3.33 | 250 |
| US2000 | USD | $1.00 | 3.33 | 250 |
| US30 | USD | $1.00 | 3.33 | 250 |
| US500 | USD | $1.00 | 3.33 | 250 |
| JP225 | JPY | $0.0067 | 500 | 37,500 |
Look at the JP225 row against UK100. Both are cash indices; both are “one lot equals one index point” in the engine’s table. But JP225 is quoted in JPY, so one point is worth $0.0067 against $1.27 — a factor of about 190. The same dollar risk therefore needs about 190 times as many lots.
We know that with unusual precision because it broke. When we first ran every strategy against every instrument, every index carried the same flat 250-lot order cap — which is not one constraint at all once a lot is worth 150 times less than US500’s. A $10,000 account risking 1% needed about 3.3 lots on US500 and about 500 on JP225, so the engine refused the order outright — tens of thousands of entries silently declined on one instrument, which in a return looks identical to a strategy that simply had no signal. The cap is now expressed as exposure rather than lot count (JP225: 250 → 37,500), and the class is guarded by a test that derives every instrument’s economics from the C++ and asserts an ordinary risk-sized position is placeable on a $1,000, a $10,000 and a $100,000 account.
0.00%
of JP225 runs now have an entry refused for being too large
Re-measured over 73,250 runs on the current build. The cap still binds a little elsewhere — US2000 1.60%, US500 1.04%, US100 0.07% — where a strategy genuinely asked for more than a broker's per-order limit. That is a constraint, not a defect. What is gone is one instrument being 150x more constrained than its peers by an accident of arithmetic.
Two limitations in the cost model, stated rather than buried
- Overnight financing is a constant, and for 10 crosses it is a deliberately conservative fallback (AUDJPY, AUDNZD, CADJPY, EURAUD, EURCHF, EURGBP, EURJPY, GBPAUD, GBPJPY, NZDJPY). Carry on a cross is a rate differential that changes with policy rates; the engine charges a flat both-sides-negative rate rather than a number it cannot source. Intraday strategies never accrue it, but a swing strategy on one of those crosses is being scored against a financing cost that is conservative rather than accurate.
- Account-currency conversion uses fixed rates, which sounds worse than it is: risk-based sizing divides by the same factor it later divides profit and loss by, so the error cancels exactly. A 2% risk request loses 2.0% however wrong the rate is — measured — which is why every figure on this page is a percentage rather than a dollar amount.
Tradability
Which instruments a $10,000 account can actually trade
There is a floor as well as a ceiling, and the floor is the one that actually binds. The smallest position a broker will accept still risks a fixed amount of money: with a class-typical stop, that is $0.02 to $10.00 across the 25 instruments — at worst 1.0% of a $1,000 account. Nothing we ship is closed to a small account by its contract size, and that is an invariant our instrument-spec test asserts rather than a happy accident.
What does bind is the interaction with the strategy’s own stop and risk percentage. A tight stop on a small risk setting asks for a position below the minimum, and the engine refuses that entry rather than rounding it up:
| Symbol | Min lot | Smallest position risks | Runs with a refused entry |
|---|---|---|---|
| US30 | 0.10 | $3.00 | 15.9% |
| AUDNZD | 0.01 | $1.80 | 13.1% |
| XAUUSD | 0.01 | $10.00 | 12.1% |
| GBPAUD | 0.01 | $1.97 | 11.5% |
| UK100 | 0.10 | $3.80 | 11.2% |
| EURCHF | 0.01 | $3.41 | 11.1% |
| EURGBP | 0.01 | $3.80 | 11.1% |
| EURAUD | 0.01 | $1.97 | 10.6% |
On 25 of the 25 instruments at least some runs hit that bound, up to 15.9% of runs on the most affected symbol — and this is at $10,000. It gets worse as the account shrinks, not better. The consequence is that the run took fewer trades than the strategy asked for, and the return has no way of telling you so — which is exactly why the engine records the count.
The other half of tradability is whether a strategy engages with the instrument at all. A strategy that stands aside is not broken — a regime filter exists to decline — but it does mean a clean-looking result can rest on almost no trading. Of the 180 strategies here, 175 traded on all 25 instruments. US30 produced the highest share of profitable strategy-years at 32.6%; AUDNZD the lowest at 8.8%. Both of those numbers are lower than any product page would like, and both are honest.
Why fixed-pip cost presets are disabled for indices and metals
One product decision follows directly from the table above, and it is worth explaining because it looks like a missing feature. For the 8 indices and metals we ship (DE40, JP225, UK100, US100, US2000, US30, US500, XAUUSD), the app refuses the fixed-pip “retail” and “raw” cost models and requires the real recorded spread. A flat one-pip assumption is a defensible simplification on EURUSD, where the recorded spread in this study was 0.37 pip. On a cash index “one pip” is one index point, and the recorded spread on JP225 ran to 7.15 points. Offering the cheap preset there would not be a simplification, it would understate every fill by a factor of about 7.
Run this on the instrument you actually trade
All 25 instruments and nine years of recorded bars, with each instrument's real spread charged by default and readable MQL5 export included on the free tier. No card.
The distribution
All 25 instruments, side by side
Here is the full table. Read it as a description of each instrument’s character, not as a ranking to pick from — the next section shows why a ranking here would not survive contact with a different strategy sample. Spread is in the instrument’s own unit: pips for FX and gold, index points for the indices.
| Symbol | Class | Median year | Median DD | Years + | Trades/yr | Spread |
|---|---|---|---|---|---|---|
| US30 | index | -6.1% | -21.4% | 32.6% | 153 | 3.23 |
| US100 | index | -8.0% | -22.8% | 29.6% | 155 | 2.20 |
| DE40 | index | -9.1% | -23.7% | 27.0% | 155 | 2.79 |
| AUDJPY | JPY cross | -11.3% | -24.7% | 25.1% | 149 | 0.91 |
| JP225 | index | -10.9% | -24.2% | 25.1% | 152 | 7.15 |
| USDJPY | JPY cross | -12.6% | -25.2% | 24.9% | 154 | 0.58 |
| EURJPY | JPY cross | -12.8% | -25.8% | 23.8% | 152 | 1.06 |
| NZDJPY | JPY cross | -14.2% | -25.9% | 22.8% | 147 | 1.28 |
| GBPJPY | JPY cross | -14.5% | -26.0% | 22.5% | 154 | 2.14 |
| US500 | index | -12.6% | -25.0% | 22.3% | 153 | 0.56 |
| CADJPY | JPY cross | -14.3% | -26.4% | 21.6% | 155 | 1.38 |
| EURUSD | FX major | -16.2% | -26.0% | 20.8% | 157 | 0.37 |
| XAUUSD | metal | -15.8% | -26.7% | 20.4% | 150 | 3.80 |
| GBPUSD | FX major | -17.3% | -27.2% | 19.5% | 160 | 1.01 |
| US2000 | index | -15.0% | -25.6% | 19.2% | 135 | 0.36 |
| NZDUSD | FX major | -20.4% | -28.9% | 16.5% | 153 | 1.24 |
| USDCHF | FX major | -22.3% | -31.6% | 14.9% | 157 | 1.12 |
| AUDUSD | FX major | -20.3% | -29.1% | 14.2% | 155 | 1.08 |
| EURAUD | FX cross | -21.0% | -29.7% | 14.0% | 152 | 2.61 |
| GBPAUD | FX cross | -22.0% | -30.9% | 13.3% | 149 | 3.82 |
| USDCAD | FX major | -23.7% | -31.9% | 13.1% | 161 | 1.29 |
| UK100 | index | -21.7% | -30.5% | 12.4% | 154 | 2.16 |
| EURCHF | FX cross | -29.0% | -35.6% | 11.7% | 153 | 1.26 |
| EURGBP | FX cross | -28.7% | -35.0% | 10.6% | 155 | 1.00 |
| AUDNZD | FX cross | -32.8% | -37.0% | 8.8% | 142 | 2.42 |
Two things to take from the shape of it. First, the median year is negative on every single instrument — this is a population of general-purpose strategies pointed at an instrument they were not built for, and that is what such a population does. Second, the range between the best and worst instrument on “years positive” is 32.6% to 8.8%, which is a real difference but a much smaller one than the difference between timeframes, and a much smaller one than the friction spread. If you were hoping the instrument choice was the lever, it is a lever, but a short one.
Daily bars, on their own window
D1 gets its own table because a one-year window cannot judge it. These 50 daily strategies ran one continuous 2018–2025 window on each instrument:
| Symbol | Median 8-yr return | Median DD | Strategies + | Trades | Spread |
|---|---|---|---|---|---|
| US100 | -0.0% | -6.2% | 48.0% | 94 | 2.34 |
| US500 | -0.1% | -7.8% | 48.0% | 89 | 0.63 |
| NZDJPY | -0.7% | -11.4% | 44.0% | 82 | 2.08 |
| AUDJPY | -1.1% | -8.6% | 42.0% | 83 | 1.35 |
| EURAUD | -1.2% | -7.8% | 38.0% | 79 | 3.50 |
| EURJPY | -1.9% | -7.7% | 38.0% | 72 | 1.57 |
| GBPAUD | -3.5% | -8.9% | 38.0% | 70 | 5.33 |
| GBPJPY | -2.2% | -7.8% | 38.0% | 76 | 3.11 |
| JP225 | -1.6% | -8.3% | 38.0% | 94 | 7.27 |
| US30 | -0.7% | -6.6% | 38.0% | 73 | 3.78 |
The caveat that outranks everything
Why a “best pair” league table is an artifact
We can test this rather than assert it, and it is the most important result on the page. For each strategy, on each instrument, take the median of its 8 yearly results — one number per cell of a strategies × instruments grid, counting only cells where the strategy actually traded at least 20 times in every year (a strategy that declines to trade scores exactly zero, which would otherwise rank it above every honest loser). Then ask: does ranking the strategies on one instrument predict their ranking on another?
The answer depends on the timeframe, and the reason it does is the whole thesis of this post:
| TF | Strategies | Pairs | Median ρ | ρ over +0.5 | Home | Transplanted |
|---|---|---|---|---|---|---|
| M5 | 15 | 300 | +0.961 | 92% | -94.9% | -96.1% |
| M15 | 33 | 300 | +0.948 | 100% | -21.5% | -28.9% |
| M30 | 24 | 300 | +0.804 | 93% | -7.5% | -12.3% |
| H1 | 58 | 300 | +0.494 | 49% | +2.3% | -8.0% |
| H4 | 22 | 276 | +0.264 | 20% | +2.6% | -3.6% |
On the fast timeframes the ranking transfers almost perfectly — M5 at ρ = +0.961 — and that is not good news. At 908 trades a year a result is decided by how much spread the strategy pays, which is a property of the strategy rather than of the instrument, so every instrument agrees about the ordering. The ranking transfers because it is a ranking of cost, not of edge. Note the home and transplanted columns for those rows: both deeply negative. The ordering is stable and worthless.
On H1 and H4 — where costs stop dominating and an edge could exist — the correlation falls to a median ρ = +0.402 across 576 instrument pairs (interquartile range +0.226 to +0.578, with 35% above +0.5). That is a moderate relationship, not none — but ρ = +0.402 means the two rankings share well under a quarter of their variance, which is nowhere near enough to pick a strategy on one instrument and expect it on another. The money settles it: the top 3 on each instrument made +2.6% at home and -5.6% everywhere else, and H4 — the slowest, least cost-dominated stratum — is also the one with the weakest transfer of all, at ρ = +0.264.
+2.6%
H1/H4 top 3, on the instrument that selected them
-5.6%
the same strategies on the other 24 instruments
+0.402
median H1/H4 rank correlation between instruments
1,476
instrument pairs measured in total
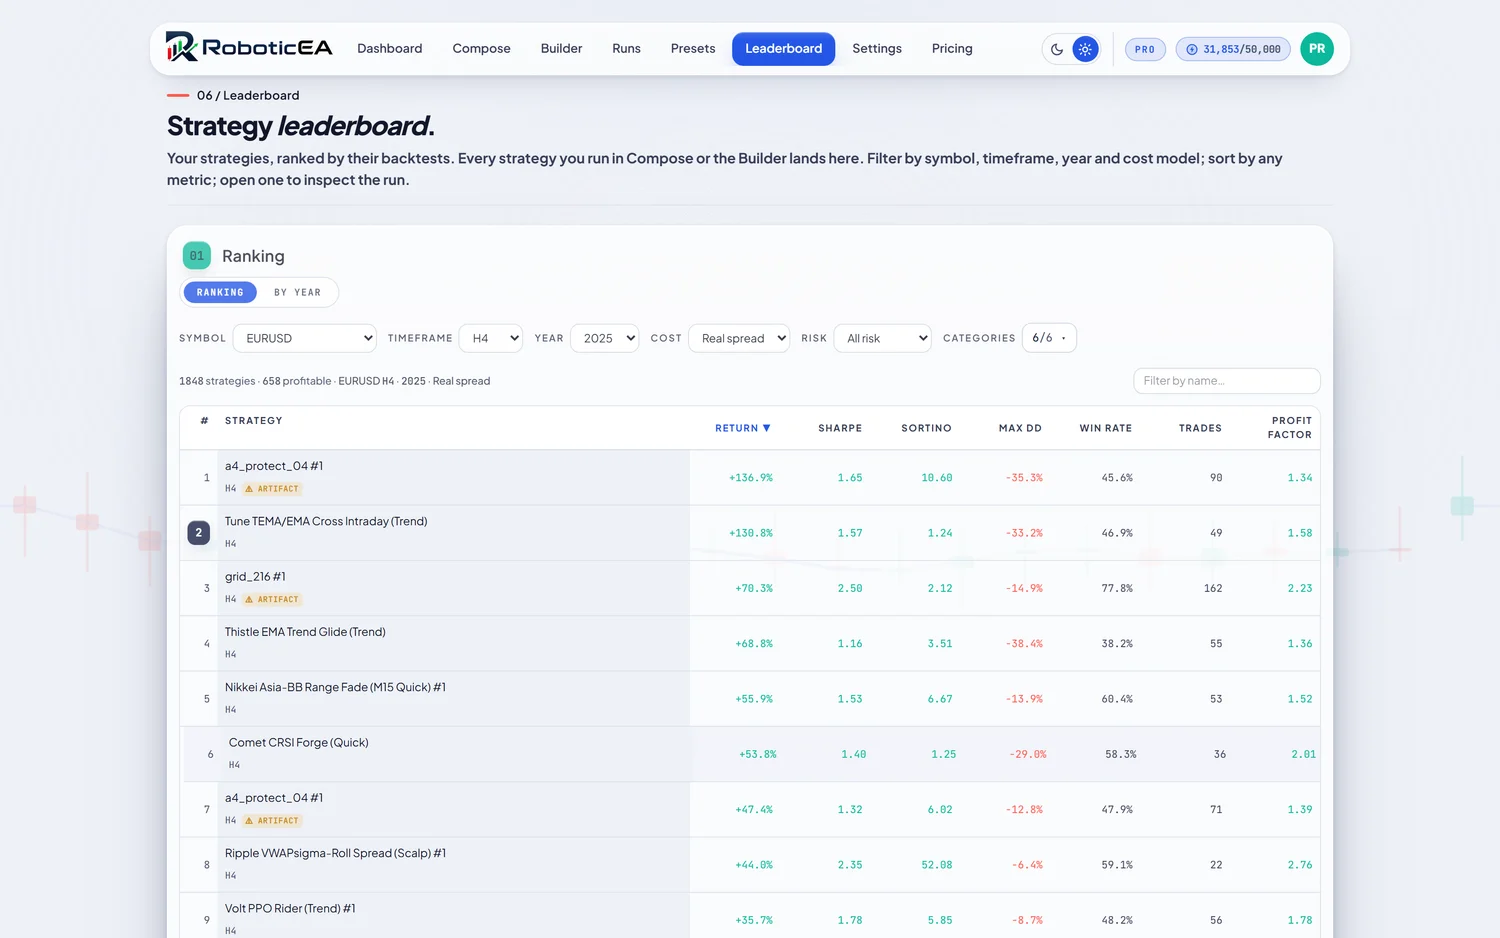
This reproduces, on 25 instruments and a fresh sample, the finding our earlier transplant study reached on twelve: strategies selected in-sample carry an edge on the instrument that selected them and lose it elsewhere. It is also why our leaderboard ranks strategies within a symbol, timeframe, year and cost model, and why its cross-pair view averages a strategy over the instruments it ran on and reports how many of them it was profitable on rather than presenting one pooled list.
EURUSD or GBPUSD, then?
It is the comparison people actually search for, so here it is with the caveat attached. On the aggregate figures the two are close: EURUSD had a median year of -16.2% against -17.3% on GBPUSD, with median drawdowns of -26.0% and -27.2%, and 20.8% versus 19.5% of strategy-years positive. The recorded spread differs more than the outcomes do — 0.37 pip against 1.01 — which puts the friction bill at 11.5 pp a year on EURUSD and 11.7 pp on GBPUSD for strategies taking a median 157 and 160 trades. So the defensible statement is about cost, not quality: EURUSD is the cheaper of the two to trade, by roughly the margin their spreads imply. Whether your particular strategy prefers one is a question only running it on both answers, and an H1/H4 rank correlation of +0.274 between them says you cannot infer it.
Frequency
Which pair is best for a scalping EA
This is where instrument choice and strategy design collide, and it has a clean answer. The spread is charged per entry, so the friction bill scales with trade count while the edge per trade does not. Pooled over all 25 instruments:
| TF | Median year | Median DD | Years positive | Median trades/yr | Strategies |
|---|---|---|---|---|---|
| M5 | -99.8% | -99.8% | 0.3% | 908 | 15 |
| M15 | -67.8% | -72.1% | 3.0% | 578 | 35 |
| M30 | -25.6% | -33.5% | 10.4% | 196 | 25 |
| H1 | -12.0% | -23.9% | 22.6% | 144 | 60 |
| H4 | -1.3% | -8.2% | 39.5% | 26 | 45 |
M5 takes about 35 times as many trades a year as H4, against price moves that are no larger in proportion. So the honest answer to “which pair is best for scalping” is: the cheapest one you have, and it will probably still not be enough. If you are set on a high-frequency EA, the instrument to pick is the one at the bottom of the friction chart — US30 at 5.8 pp a year — and the instruments to avoid are the ones at the top, where AUDNZD charges 22.3 pp. Our timeframe study goes into this dimension properly.
Practical
How to choose an instrument for an EA
Not “which pair wins” but “which pair can this strategy afford”. Six questions, in the order that decides fastest:
- What does the spread cost per year, in account terms? Multiply the recorded spread by how many trades a year the strategy takes, in the money the account is denominated in. On this data that number ranged from 5.8 pp to 22.3 pp — wider than most strategies’ entire edge.
- Was the backtest charged the instrument’s own spread, or a flat pip? On AUDNZD, 28.5% of the results in this study were profitable only with the cost removed. A flat-pip assumption on an index or a metal is not a simplification, it is a different instrument.
- Can the account size a position at all? Check the smallest tradeable position against your equity, and the largest against your risk. The engine refuses an order it cannot size and the return will not tell you it happened.
- Does the strategy hold overnight? If so, financing is a real line item and on a currency cross it is a rate differential that no constant models well.
- Is the result quoted per year, with the drawdown beside it? The median instrument in this study had a negative median year. One good window on one instrument is not evidence.
- Ignore “best pair” rankings, including any you could build from the table above. Median H1/H4 rank correlation between instruments was +0.402. Choose the instrument on cost and tradability, then validate the strategy on it directly.
FAQ
Instrument questions, answered
What is the best forex pair for an expert advisor?
There is no pair that is best in the sense the question implies. We ran the same 180 strategies on all 25 instruments we ship across the eight full years from 2018 to 2025, with each instrument's real recorded spread charged inside the simulation, and the instruments differed far more in what they cost than in how well they treated a strategy. The friction bill ranged from 5.8 percentage points of the account a year on US30 to 22.3 on AUDNZD. Choose an instrument on cost and tradability, then validate your specific strategy on it — a ranking of pairs built from strategy returns does not transfer.
Is EURUSD or GBPUSD better for an EA?
On our data they are close, and EURUSD is the cheaper of the two. EURUSD's recorded spread averaged 0.37 pip against 1.01 on GBPUSD, which puts the friction bill at 11.5 percentage points of the account a year against 11.7, for strategies taking a median 157 and 160 trades. The outcomes were similar: a median year of -16.2% on EURUSD against -17.3% on GBPUSD, median maximum drawdowns of -26.0% and -27.2%, and 20.8% versus 19.5% of strategy-years positive. The rank correlation between the two instruments was only +0.274, so which one your particular strategy prefers cannot be inferred — you have to run both.
Which instrument is cheapest to run an EA on?
Cash indices, as a class. Comparing identical backtests with and without costs, the median friction bill was 8.9 percentage points of the account a year across the seven indices, 12.0 on gold, 12.8 on the yen crosses, 14.8 on the FX majors and 18.0 on the non-yen crosses. US30 was the cheapest single instrument at 5.8 and AUDNZD the dearest at 22.3. Note this is cost in account terms rather than spread in pips: a wide-looking 7.15-point spread on JP225 is small relative to that index's range, while a 2.42-pip spread on a quiet cross is not.
Which pair is best for a scalping EA?
The cheapest one you have, and it will probably still not be enough. Pooled across all 25 instruments, M5 strategies had a median year of -99.8% with a median maximum drawdown of -99.9% and only 0.3% of strategy-years positive, against -1.3% and 39.5% positive on H4. M5 took about 35 times as many trades a year as H4 — 908 against 26 — against price moves no larger in proportion. The spread is charged per entry, so trade frequency multiplies it while the edge per trade does not.
Can a $10,000 account trade indices and gold with an expert advisor?
Yes. With a class-typical stop, the smallest position the modelled broker accepts risks between $0.02 and $10.00 depending on the instrument — at worst 1.0% of a $1,000 account — so nothing we ship is closed to a small account by its contract size. The constraint that does bite is the strategy's own stop and risk setting: on all 25 instruments some runs asked for a position below the minimum order size and had that entry refused, up to 15.9% of runs on the most affected symbol, and it gets worse as the account shrinks rather than better.
Why does the same EA perform so differently on different pairs?
Partly cost and partly fit, and the second part is larger than most people expect. Among H1 and H4 strategies, the rank correlation of the same strategies between two instruments had a median of only +0.402 over 576 instrument pairs, and the top three strategies on each instrument — chosen using that instrument's own eight-year record — made a median +2.6% at home and -5.6% when moved to the other 24. A strategy that tops a leaderboard on one instrument has told you about that pairing, not about itself.
Are indices better than forex pairs for automated trading?
They were cheaper, and in this sample they treated an outside strategy less badly: a median year of -11.8% with a median maximum drawdown of -24.4% and 24.0% of strategy-years positive, against -20.0%, -28.9% and 16.5% for the FX majors. But the median year was negative on all 25 instruments, indices included, and indices carry their own hazards. They price spread-only, so a fixed-pip cost assumption is meaningless on them, and one of them — JP225 — is quoted in yen, which makes one lot worth about 150 times less than a US index lot.
Everything above is reproducible: 73,250 runs, engine build 0.2.0, seed 20260817, $10,000 per run, on real market bars, with the contract economics parsed out of the engine’s own source rather than restated. The engine itself is checked run-for-run against MetaTrader 5’s own Strategy Tester on real ticks, and the companion archetype study covers the dimension that turned out to matter more than instrument choice. The same instruments, timeframes and years are in the product, so you can run the parts you doubt — here is how the workflow fits together, and here is what the per-year validation grid is telling you.
Keep reading
Gold, in depth: 16,400 XAUUSD backtests
The same strategy sample on the most expensive instrument we ship, year by year, and what its spread hides.
The other half of the decision: timeframe
Instrument sets the price per trade; timeframe sets how often you pay it. Measured separately.
Do forex robots actually work?
The prior question, answered over the same engine: how often an automated strategy survives at all.
Getting a free expert advisor for MetaTrader 5
How to generate, validate and export readable MQL5 source without paying for a black box.