

Data study
Best timeframe for expert advisors: what 88,750 backtests say
 Tommy JayFounder, RoboticEA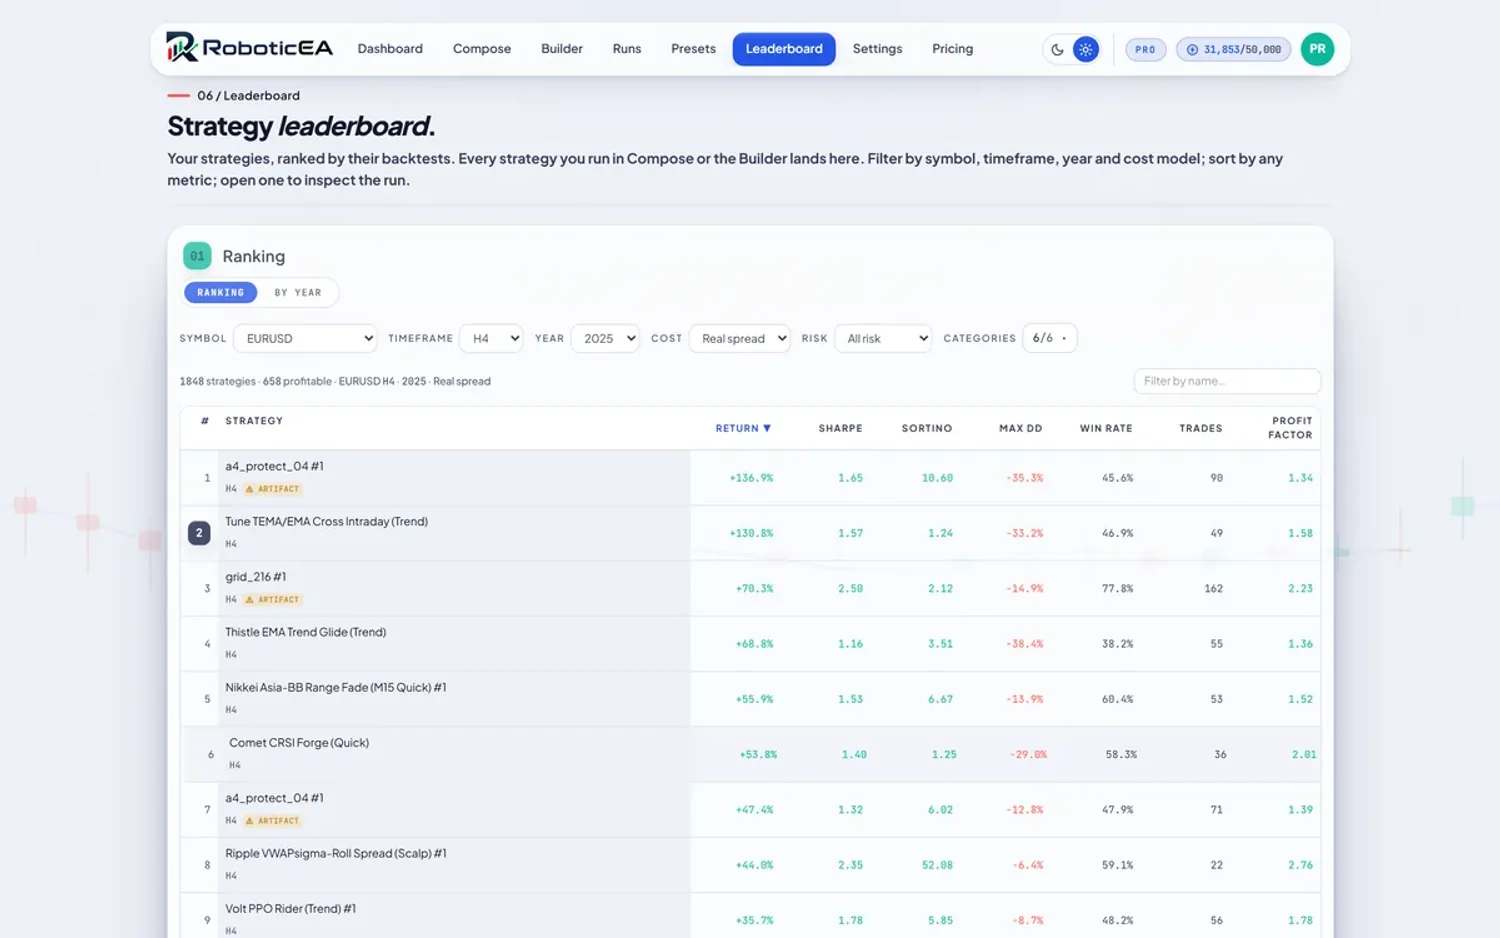
“Which timeframe should I run my EA on?” is normally answered with taste. It is measurable, and the answer is not subtle. We took 2,050 strategies stratified by timeframe, ran each one as an independent backtest on every one of the 8 full years from 2018 to 2025, on EURUSD and again on XAUUSD, and then re-ran the identical EURUSD cells with every trading cost switched off. That is 121,870 backtests, and they all say the same thing for the same reason.
The short answer
The short version
Which timeframe wins, and by how much
Across 16,400 yearly EURUSD backtests the ranking is monotonic in timeframe: every step slower improved the median year, improved the share of years that ended positive, and shrank the median drawdown. Nothing else in either study behaves this cleanly.
37.9%
of H4 strategy-years positive
0.2%
of M5 strategy-years positive
31x
M5 takes 31x as many trades a year as H4
0.34 pip
spread per trade on M5 — and 0.43 pip on H4
That last pair is the whole argument in two numbers. The spread barely moves between timeframes, because it belongs to the instrument. The trade count moves by a factor of 31. And the consequence is not a mild drag: 31.8% of M5 strategy-years on EURUSD ended in a total loss of the account, against 0.0% at H4.
The mechanism
Why the timeframe is a cost decision, not a style decision
Every trade pays the spread once on the way in. Nothing about a five-minute chart makes that spread smaller — it makes the move you are trying to capture smaller, while the toll stays the same size. Run the same strategy logic faster and you multiply the number of tolls without multiplying the size of the moves.
You can see it as a bill. Our runs report commission and swap as line items, so the friction is not folded into the headline. On EURUSD, the median M5 strategy paid $4,098 of commission in a year against $63 on H4 — from the same $10,000 account.

11.8% → 1.6%
the yearly friction bill on H1 and on H4, on EURUSD
What the median strategy-year gave up to spread, commission and swap, measured by running the identical cell again with all of it switched off. 5,600 H1 cells and 4,000 H4 cells, same strategies, same $10,000 account, engine build 0.2.0.
This is why the effect cannot be trained away. It is arithmetic, and it applies to a hand-written EA, a bought one and a generated one identically — which is a large part of why most forex robots do not work, whatever logic is inside them.
Method
What we tested, and how
- The sample is stratified by timeframe, and it has to be. Our preset library of 20,143 is 62.1% H1. Draw a uniform sample and the “timeframe cross-section” would mostly be a statement about the library’s composition — a pooled ranking over unbalanced strata is a ranking of the strata. The quota is fixed per timeframe (H1 700, H4 500, M15 400, M30 300, M5 150, D1 300) and drawn from a seeded shuffle (20260817), so it regenerates exactly.
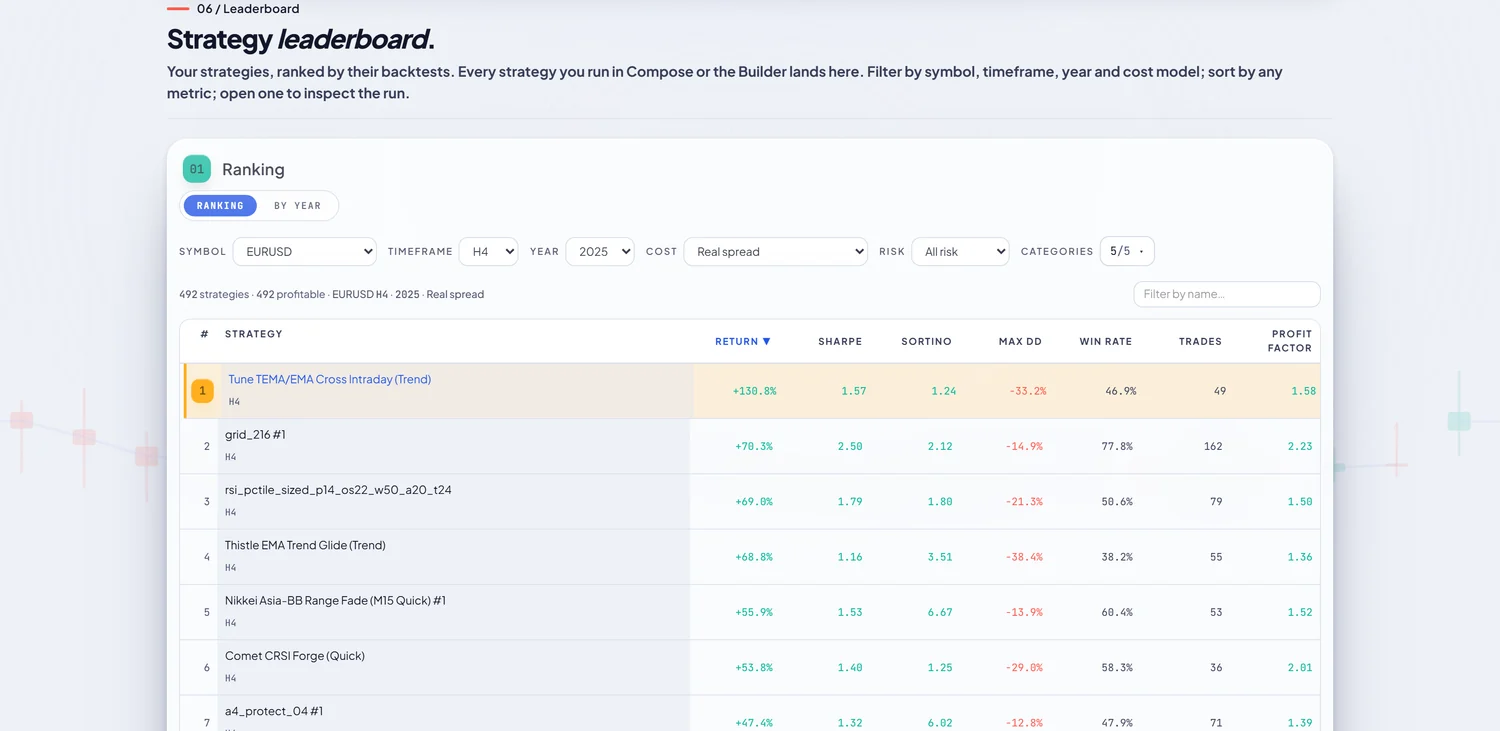
- One year at a time. Each of the 8 years is an independent backtest from the same $10,000. “Positive in 6 of 8years” is a claim one compounded figure cannot make.
- Two instruments, the same strategies. Only the symbol changes between the EURUSD study and the XAUUSD one — same seed, same presets, same years, same engine build (0.2.0). So the two gradients are a paired comparison, not two separate experiments that happen to agree.
- A matched zero-cost arm. Every EURUSD cell was run twice: once with the real recorded per-bar spread, commission and swap charged inside the simulation, and once with all of it removed. Nothing else differs, which is what makes it a test of the cause rather than a description of the symptom.
- Daily bars handled separately. D1 is run over one wide window and is never pooled with the intraday timeframes per year — see below for why that is not a convenience.
- 33,100 runs on EURUSD, 0 failures, every one on real market bars (rbar, rbar-m5) — asserted, not assumed, because an engine given no data will quietly invent it and every number after that is fiction.
One limitation, stated plainly: these are library strategies pointed at a timeframe, not strategies designed for one. That is deliberate — it is what happens when you attach an EA to a chart — but it means the study measures how a timeframe treats an outside strategy, which is the question a buyer actually faces.
The result
The gradient on EURUSD
EURUSD is the cheapest major pair there is — the median spread our runs paid was 0.37 pip. If the timeframe effect were a gold quirk, this is where it would disappear. It does not.
| TF | Median year | Median DD | Years positive | Trades/yr | Spread | 6+ of 8 |
|---|---|---|---|---|---|---|
| M5 | -99.9% | -99.9% | 0.2% | 1,075 | 0.34 pip | 0 |
| M15 | -64.6% | -68.6% | 3.0% | 528 | 0.34 pip | 0 |
| M30 | -33.3% | -41.9% | 10.3% | 303 | 0.34 pip | 0 |
| H1 | -13.8% | -26.2% | 23.0% | 170 | 0.37 pip | 5 |
| H4 | -1.8% | -9.2% | 37.9% | 35 | 0.43 pip | 8 |
The last column is the one to sit with. Of 2,050 strategies, 13 were profitable in at least six of the 8 years, and 8 of those were H4. Only 0 came from the two fastest timeframes combined.
And “consistent” needs one more filter before it means anything. Of those 13, 11 also traded at least 20 times in every single year — a strategy that takes four trades a year has a fair chance of a positive year and tells you nothing, which is why our app refuses to issue a verdict below that floor. Here they are, ranked by consistency rather than by return:
| Years up | TF | Mean year | Worst year | Worst DD | Min trades/yr |
|---|---|---|---|---|---|
| 7 / 8 | H4 | +1.62% | -10.42% | -11.0% | 25 |
| 6 / 8 | H1 | +4.19% | -7.71% | -12.5% | 65 |
| 6 / 8 | H1 | +6.54% | -10.19% | -47.2% | 160 |
| 6 / 8 | H4 | +5.11% | -10.22% | -15.9% | 23 |
| 6 / 8 | H4 | +2.69% | -10.65% | -12.9% | 49 |
| 6 / 8 | H4 | +3.07% | -12.76% | -19.2% | 82 |
| 6 / 8 | H4 | +8.96% | -13.67% | -23.9% | 56 |
| 6 / 8 | H4 | +5.99% | -20.82% | -21.8% | 34 |
| 6 / 8 | H1 | +8.31% | -33.25% | -36.4% | 45 |
| 6 / 8 | H1 | +8.86% | -36.69% | -41.5% | 84 |
| 6 / 8 | H1 | +10.70% | -41.34% | -49.6% | 154 |
Every one of them is H4 or H1. Not a single strategy from M5, M15, M30 cleared the bar — 850 strategies across three timeframes, no survivors.
For an independent check on the H1 row: our archetype study is 594,580 runs of 84,940 freshly generated strategies on EURUSD H1 — a completely different population, generated rather than drawn from the library, over 6 years rather than 8. It puts H1 at 16.7% of years positive on a median of 165 trades a year, against 23.0% and 170 here. Two unrelated samples, the same neighbourhood. That study is H1-only, so it has no timeframe gradient of its own to offer — it is a baseline, not a second gradient.
The causal test
Switch the costs off and the ranking collapses
A ranking is not a mechanism. If the timeframe gradient really is the spread being paid more often, then removing the spread should remove most of the gradient — and if the gradient survives, our explanation is wrong. So we re-ran every cell at zero cost.
| TF | Years positive, real | Years positive, zero cost | Median year, real | Median year, zero | Cells flipped |
|---|---|---|---|---|---|
| M5 | 0.2% | 29.7% | -99.9% | -48.6% | 354 (29.5%) |
| M15 | 3.0% | 33.5% | -64.6% | -11.9% | 978 (30.6%) |
| M30 | 10.3% | 40.4% | -33.3% | -4.6% | 724 (30.2%) |
| H1 | 23.0% | 45.9% | -13.8% | -1.1% | 1,286 (23.0%) |
| H4 | 37.9% | 46.2% | -1.8% | -0.2% | 332 (8.3%) |
56%
of the timeframe gap closes when the costs come off
With the real spread charged, the spread in "years positive" between M5 and H4 is 37.7%. On the identical runs with commission, swap and spread all removed it is 16.5%. Nothing about the strategies changed — only what the trade was charged.
Note which timeframe the cheaper assumption flatters most: 29.5% of M5 cells were profitable only because nothing was charged, against 8.3% of H4 cells. A scalping EA whose backtest used a flat or optimistic spread is the single most over-flattered thing in this dataset — which is precisely the category that sells best. With the costs off, 30 M5 strategies appear with a record of six or more profitable years out of 8. Charge the real spread on the same runs and there are none.
The gradient does not vanish entirely, and we should say so. Even with costs off, the median M5 year was -48.6% with a median drawdown of -74.1%: faster trading also means more exposure to noise and more chances to be stopped out. Cost is the dominant term, not the only one.
Run the timeframe test on your own strategy
Pick a strategy, pick a timeframe, and get the per-year record with the real spread charged. Free account, no card, MetaTrader 5 export included.
Second instrument
The same strategies on gold, and why the pip figure misleads
Gold’s recorded spread is about 10 times EURUSD’s in pips — 3.81 pip against 0.37 pip at H1. The obvious prediction is that the timeframe gradient should be far steeper on gold. Run the identical sample on both and that prediction is wrong, which turns out to be the more useful result:
| TF | EURUSD median year | EURUSD DD | XAUUSD median year | XAUUSD DD | EURUSD positive | XAUUSD positive |
|---|---|---|---|---|---|---|
| M5 | -99.9% | -99.9% | -99.7% | -99.7% | 0.2% | 0.0% |
| M15 | -64.6% | -68.6% | -89.0% | -91.6% | 3.0% | 4.4% |
| M30 | -33.3% | -41.9% | -64.2% | -72.2% | 10.3% | 6.4% |
| H1 | -13.8% | -26.2% | -31.1% | -50.6% | 23.0% | 18.7% |
| H4 | -1.8% | -9.2% | -3.9% | -19.7% | 37.9% | 37.9% |
A pip is not a comparable unit across instruments. Gold moves in far bigger pip increments than EURUSD does, so a 3.81 pip toll on gold and a 0.37 pip toll on EURUSD are closer in real terms than the headline figures suggest. The comparable unit is what the friction actually removes from the account, and we can measure that directly: it is the difference between each cell and itself at zero cost.
| TF | EURUSD spread | XAUUSD spread | EURUSD bill/yr | XAUUSD bill/yr | Trades/yr |
|---|---|---|---|---|---|
| M5 | 0.34 pip | 3.66 pip | 44.1% | 50.6% | 1,075 |
| M15 | 0.34 pip | 3.71 pip | 40.5% | 43.2% | 528 |
| M30 | 0.34 pip | 3.74 pip | 25.9% | 24.7% | 303 |
| H1 | 0.37 pip | 3.81 pip | 11.8% | 12.7% | 170 |
| H4 | 0.43 pip | 4.05 pip | 1.6% | 2.3% | 35 |
At H1 the two instruments are 10x apart in spread per trade and land within a percentage point or so of each other on the yearly bill — 11.8% of the account on EURUSD against 12.7% on gold. The instrument changes what one crossing costs; the timeframe changes how many crossings you buy, and the second factor is the one that varies by 31x.
On gold, M5 produced not one profitable strategy-year out of 1,200, at a median of -99.7% on a median drawdown of -99.7% — an account destroyed — while H4 came in at -3.9% with 37.9% of years positive. The 15x trade-count ratio between them is the same mechanism as on EURUSD. The gold study goes through that instrument in full.
The generalisation worth taking from the pair: the timeframe effect is not an instrument quirk. It reproduced on the cheapest major pair there is, at the same slope, and it is not something a wide-spread market invented. Do not read the pip figure and conclude a fast timeframe is affordable because the number looks small — read what the friction removes from the account over a year.
D1 and W1
Daily bars, and the window trap that hides them
If slower is better, why not go straight to daily? Two reasons, and the first one is a measurement problem rather than a trading one.
A calendar year is about 260 daily bars. That is not enough for most strategies to take enough trades for the result to mean anything. Separately from this study, we measured 102 generated specs per timeframe on a one-year EURUSD window:
| TF | Window | Median trades | Under 20 trades | Share |
|---|---|---|---|---|
| H1 | 1 year | 176 | 1 | 0.0% |
| H4 | 1 year | 53 | 5 | 4.9% |
| D1 | 1 year | 12 | 90 | 88.2% |
| D1 | 6 years | 69 | 7 | 6.9% |
88.2% of daily strategies could not earn a verdict on one year, against 0.0% at H1. Widen the window to 6 years and that falls to 6.9%. Nothing about the strategies changed; the window was simply the wrong shape for the timeframe. This is why our app opens a wider default window the moment you select D1 or W1, and why we never pool D1 with the intraday timeframes on a per-year basis.
What daily bars returned once the window fitted
Run properly — one wide 2018-01-01..2025-12-31 window, 300 daily strategies — D1 on EURUSD came in at a median -4.4% over the whole 8-year window with a median drawdown of -9.3%, 23.7% of strategies positive, on a median of 93 trades in total — roughly 12a year. Gold’s D1 arm lands in similar territory — -3.7% on a median drawdown of -15.1% with 34.3% of strategies positive — though over its own slightly longer 2018-01-01..2026-06-30 window, so the two are not the same cell and should not be read as a paired comparison.
The second reason is practical, and the same data shows it: even given the whole 8-year window, 74.7% of those daily strategies still averaged under 20 trades a year. At 12 trades a year you will wait years to find out whether a daily strategy works, and a bad run of four trades is indistinguishable from a broken idea. H4 is the compromise the data supports — slow enough that the spread stops dominating, fast enough that a year of live trading tells you something.
Robustness
Does it hold in every year, or just on average?
A gradient that only exists in the pooled average is a gradient that one unusual year could have produced. Taken one year at a time, the ordering was fully monotonic across all five timeframes in 7 of the 8 years, the exception being 2023:
| Year | M5 | M15 | M30 | H1 | H4 |
|---|---|---|---|---|---|
| 2018 | -99.8% | -57.0% | -27.7% | -9.1% | -4.4% |
| 2019 | -99.9% | -75.7% | -40.1% | -19.4% | +0.0% |
| 2020 | -99.8% | -60.7% | -36.7% | -6.0% | +2.5% |
| 2021 | -99.9% | -72.9% | -35.6% | -16.0% | -3.6% |
| 2022 | -99.8% | -50.3% | -29.2% | -19.8% | -1.0% |
| 2023 | -99.9% | -64.4% | -30.0% | -2.2% | -4.2% |
| 2024 | -99.9% | -70.7% | -35.3% | -22.9% | -2.4% |
| 2025 | -99.9% | -64.2% | -34.1% | -11.2% | -1.2% |
The single exception is instructive rather than damaging: in 2023, H1 and H4 swapped places at the slow end of the range while the fast end stayed exactly where it always is. No year in the sample put a fast timeframe above a slow one.
Compare that with the instrument-quality swing in the gold study, where the same strategies went from 6.5% of results positive in 2018 to 33.5% in 2025. Which years you test moves the level enormously. It does not move the timeframe ordering.
Practical
How to choose a timeframe for your EA
You do not need our software to apply this. Five steps, in order:
- Start at H4, not at M5. On both instruments it had the best median year, the shallowest median drawdown and the most strategies that survived six or more years. If a slower timeframe cannot make your idea work, a faster one will not rescue it — it will only pay the spread more often.
- Divide the spread by your average winning trade. That single ratio is what the timeframe really changes. If the spread is a meaningful fraction of the move you are trying to capture, no amount of parameter work will fix the arithmetic.
- Do not let a small pip figure reassure you. EURUSD’s 0.34 pipspread sounds harmless next to gold’s, and it produced the same gradient. What matters is the friction against the size of the move, and over a year it lands in a similar place on both instruments.
- Match the window to the timeframe. A one-year backtest cannot judge a daily strategy — 88.2% of them cannot even reach 20 trades. Judge D1 over many years, or do not claim to have judged it.
- Check the spread the backtest actually charged, in pips. If a result does not tell you, you cannot know whether you are looking at an edge or a missing cost. In this dataset that one variable moved 29.5% of M5 results across the profit line. The same question applies to a free EA you download as to a paid one.
FAQ
Timeframe questions, answered
What is the best timeframe for an expert advisor?
Of the five we tested, H4 was clearly the best and M5 clearly the worst, with a monotonic ranking in between. On EURUSD, 37.9% of H4 strategy-years finished positive on a median year of -1.8% and a median maximum drawdown of -9.2%, against 0.2% of M5 years positive on a median of -99.9% and a drawdown of -99.9%. The same ordering appeared on XAUUSD. The reason is cost: the spread is charged per trade, and the median M5 strategy took about 1,075 trades a year against 35 on H4.
Is M5 or M15 a good timeframe for a forex robot?
On our data, no. Across 1,200 M5 strategy-years on EURUSD only 0.2% ended positive, the median year lost 99.9% with a median drawdown of -99.9%, and 31.8% ended in a total loss of the account. M15 managed 3.0% of years positive on a median of -64.6% and a drawdown of -68.6%. Friction alone took a median 44.1% of the account per year at M5, against 1.6% at H4 — and that figure is a lower bound, because an account cannot lose more than everything.
Which timeframe is most profitable for algo trading?
H4 was the least unprofitable rather than reliably profitable, and the distinction matters. Its median EURUSD year was still -1.8% with a median drawdown of -9.2%, and only 8 of 500 H4 strategies were profitable in six or more of the eight years. Out of 2,050 strategies across five timeframes, 11 were profitable in at least six years while also trading at least 20 times in every year — and every one of those 11 was H1 or H4. Not one came from M5, M15 or M30, out of 1,750 tested on those three.
M5 vs H1 vs H4 — what does the data actually show?
On EURUSD from 2018 to 2025 with the real recorded spread charged: M5 had a median year of -99.9%, 0.2% of years positive and about 1,075 trades a year; H1 -13.8%, 23.0% positive, 170 trades; H4 -1.8%, 37.9% positive, 35 trades. Median maximum drawdowns were -99.9%, -26.2% and -9.2%. The spread per trade barely differed across the three (0.34, 0.37 and 0.43 pip). What differed was how many times a year it was paid.
Does the best timeframe depend on the currency pair?
Less than the spread figures suggest. Gold's recorded spread is roughly ten times EURUSD's in pips, yet the same 2,050 strategies produced the same ranking on both, with similar numbers: 39.5% of H4 gold years positive against 37.9% on EURUSD, and 0.0% of M5 gold years against 0.2%. Measured as a share of the account, the yearly friction bill at H1 was 11.8% on EURUSD and 12.7% on gold. A pip is not a comparable unit across instruments; what the friction removes from the account over a year is.
Can a daily (D1) EA be judged on a one-year backtest?
No. One calendar year is about 260 daily bars. In a separate measurement of 102 generated specs per timeframe on a one-year EURUSD window, 88.2% of D1 strategies could not reach the 20 trades a verdict needs, on a median of 12 trades, against 0.0% unjudgeable at H1. Widening the window to six years takes that to 6.9%. Run properly over one wide eight-year window, 300 daily EURUSD strategies had a median return of -4.4% with a median drawdown of -9.3% and 23.7% positive — but at roughly 12 trades a year, and 74.7% still averaged under 20 trades a year.
Why do fast-timeframe EAs look good in backtests and fail live?
Usually because the backtest undercharged the spread, and the faster the timeframe the more that matters. We re-ran all 16,400 EURUSD cells with every cost removed: 29.5% of M5 strategy-years turned profitable purely because nothing was charged, against 8.3% of H4 years. With costs off, 30 M5 strategies appear with six or more profitable years out of eight; charge the real recorded spread on the identical runs and there are none. Overall, removing costs closes 56% of the gap between the fastest and slowest timeframe.
Everything above is reproducible: 33,100 EURUSD runs and 88,770 XAUUSD runs, engine build 0.2.0, seed 20260817, $10,000 per run, on real market bars. The same instruments, timeframes and years are in the product, so you can re-run the parts you doubt — here is how the workflow fits together.
Keep reading
The same test, on gold
The companion study: the same strategies on XAUUSD, and what a ten-times wider spread per trade does and does not change.
594,580 backtests across 34 archetypes
The H1 baseline this post checks itself against, and the dimension that turned out to matter more than strategy choice.
Does our engine agree with MetaTrader 5?
Run for run against MT5's own Strategy Tester on real ticks — the study underneath every number here.
Which pair should an EA trade?
The other half of this decision: the instrument sets what a trade costs, and the timeframe sets how often you pay it.
Do forex robots actually work?
The base rates behind every number here, and what separates the survivors from the rest.
How the per-year validation works
Why every strategy is re-run on each year separately, and why the window widens when you pick D1.