

Data study
Best gold expert advisor for MT5: what 9 years of XAUUSD backtests actually show
 Tommy JayFounder, RoboticEA
Search for a gold expert advisor and you will be offered dozens, most with a smooth equity curve and a three-figure return. So we ran the test ourselves: 1,966 strategies on XAUUSD, each backtested independently on every one of the 8 full years from 2018 to 2025, with gold’s real recorded per-bar spread charged inside the simulation — and repeated at 2%, 3%, 4% risk per trade, because the risk setting turns out to decide more than the strategy does. That is 88,770 backtests in all.
The short answer
The honest answer
Is there a “best gold expert advisor”?
The question assumes a gold EA is a product you can rank, like a phone. What the data says is that it is closer to a lottery ticket whose odds you can measure. Across our sample, a gold strategy’s single most likely outcome in any given year was a loss of about a sixth of the account.
+162%
what the best gold strategy did to a $10,000 account over 8 years
At 3% risk per trade, real recorded spread, 105 trades a year — and a -61.0% drawdown on the way, with 3 losing years. Engine build 0.2.0. Ranked by what the account actually did, not by the average of its yearly returns.
That is the number worth carrying away, because it is the one no vendor page shows you. It is not that gold cannot be traded systematically — 2 strategies came within one year of a clean sweep, and 22 cleared six of 8or better. It is that the survival rate is low enough that any single impressive curve is far more likely to be luck, or a cost model that never charged gold’s real spread.
Method
What we tested, and how
We drew 2,350 strategies from our preset library of 20,143, stratified by timeframe so the result could not turn into a statement about which timeframe the library happens to contain most of. The sample is seeded (20260817), so it regenerates exactly. 384 of them size positions by a fixed lot or an expression rather than by risk, and a risk override would mean something different to those, so they sit out the risk arms — leaving 1,966.
- One instrument.Every strategy’s symbol was rewritten to XAUUSD, keeping its own timeframe and its own risk per trade — the same substitution our cross-pair validation performs.
- One year at a time. Each year is an independent backtest starting from the same $10,000, because “profitable in 7 of 8 years” is a claim a single compounded figure cannot make.
- Real spread, inside the simulation.Gold’s recorded per-bar spread plus broker commission and overnight swap are charged as the trade happens, not estimated afterwards.
- Daily charts handled separately. One calendar year is about 260 daily bars, too few for most D1 strategies to reach a judgeable number of trades, so D1 was run over one wide window and is reported on its own.
- 88,770 runs, 0 failures, one engine build (0.2.0), every run on real market bars — asserted, not assumed, because an engine given no data will quietly invent it.

One limitation, stated plainly: these are general-purpose strategies pointed at gold, not strategies tuned on gold. That is deliberate — it is exactly what happens when you download an EA and attach it to XAUUSD — but it means this measures how gold treats an outside strategy, which is a harsher and more realistic question than how well a strategy can be fitted to gold’s past.
The distribution
What 15,728 gold backtests actually look like
-38.5%
median year
17.4%
of years positive
-54.5%
median max drawdown
+644%
best single year
Both ends of that row matter. Somebody in this sample really did turn +644% in a year on gold — and if we were selling a gold EA, that is the curve you would be looking at right now. But the same population has a median year of -38.5%, a median worst-case drawdown of -54.5%, and 0.78% of years that ended in a total loss of the account. The 95th percentile year — the top one in twenty — was +22.7%.
| Profitable years (of 8) | Strategies | Share of sample |
|---|---|---|
| 8 of 8 | 0 | 0.0% |
| 7 of 8 | 2 | 0.1% |
| 6 of 8 | 20 | 1.0% |
| 5 of 8 | 60 | 3.1% |
| 4 of 8 | 135 | 6.9% |
| 3 of 8 | 252 | 12.8% |
| 2 of 8 | 315 | 16.0% |
| 1 of 8 | 371 | 18.9% |
| 0 of 8 | 811 | 41.3% |
What worked
The best gold strategies — and the trap in ranking them
Here is where our first pass at this study went wrong, and it is worth saying plainly. We ranked by consistency — how many years a strategy made money — which sounds prudent and quietly guarantees the answer. It selects strategies that trade rarely and move little, and it pushes to the bottom exactly the profile most people actually run: big gains concentrated in a couple of years, with losing years in between.
So both rankings are below. They do not contain the same strategies, and the difference between them is the whole point.
| Mean / yr | Compounded | Years up | Worst year | Worst DD | Best year is |
|---|---|---|---|---|---|
| +45.4% | -16% | 3 / 8 | -70.1% | -77.3% | 72% |
| +28.9% | -66% | 3 / 8 | -74.2% | -77.7% | 56% |
| +21.2% | +162% | 5 / 8 | -38.1% | -61.0% | 49% |
| +16.8% | +123% | 6 / 8 | -45.2% | -57.4% | 51% |
| +14.8% | -90% | 3 / 8 | -81.5% | -86.9% | 94% |
| +14.2% | -79% | 2 / 8 | -74.4% | -80.5% | 58% |
| +13.2% | -100% | 1 / 8 | -98.5% | -98.6% | 100% |
| +10.9% | -35% | 4 / 8 | -62.8% | -69.0% | 44% |
6 of 8
of the highest-averaging gold strategies actually LOST money
The arithmetic mean of yearly returns is dominated by one big year, so a strategy can average a healthy-looking figure while the account shrinks. The worst case here averaged +13.2% a year and finished at -100%: the account was gone. Always ask what the balance did, never what the years averaged.
That is why the headline of this post is a compounded figure. Ranked by what the account actually did, the best gold strategy in 1,966 turned $10,000 into +162% over 8 years — and it did so with 3 losing years, a -61.0% drawdown, and 49% of its gains coming from one year.
| Years up | TF | Mean / yr | Worst year | Worst DD | Trades/yr |
|---|---|---|---|---|---|
| 6 / 8 | H4 | +4.9% | -25.5% | -31.4% | 37 |
| 6 / 8 | H4 | +3.0% | -28.8% | -35.3% | 50 |
| 6 / 8 | H1 | +16.8% | -45.2% | -57.4% | 104 |
| 5 / 8 | H4 | +2.5% | -8.8% | -21.3% | 33 |
| 5 / 8 | H4 | +2.7% | -12.3% | -21.5% | 24 |
The dial that decides
Risk per trade changes the answer more than the strategy does
Every number above is quoted at 3% risk per trade. That is not a detail. We ran the identical 1,966 strategies across the whole band and the distribution does not shift — it widens:
| Risk / trade | Median year | Best mean / yr | Averaging 25%+ | Median DD | Years ending in ruin |
|---|---|---|---|---|---|
| 2% | -25.8% | +20.5% | 0 | -39.7% | 0.17% |
| 3% | -38.5% | +45.4% | 2 | -54.5% | 0.78% |
| 4% | -50.5% | +87.4% | 6 | -66.2% | 1.70% |
Going from 2% to 4% takes the best average year from +20.5% to +87.4% and the number of strategies averaging 25% or better from 0 to 6. It also takes the median year from -25.8% to -50.5%, the median drawdown to -66.2%, and the share of years that end with the account wiped out from 0.17% to 1.70%. Raising risk does not improve your odds. It raises the stakes on both sides.
What one of them looks like in the app
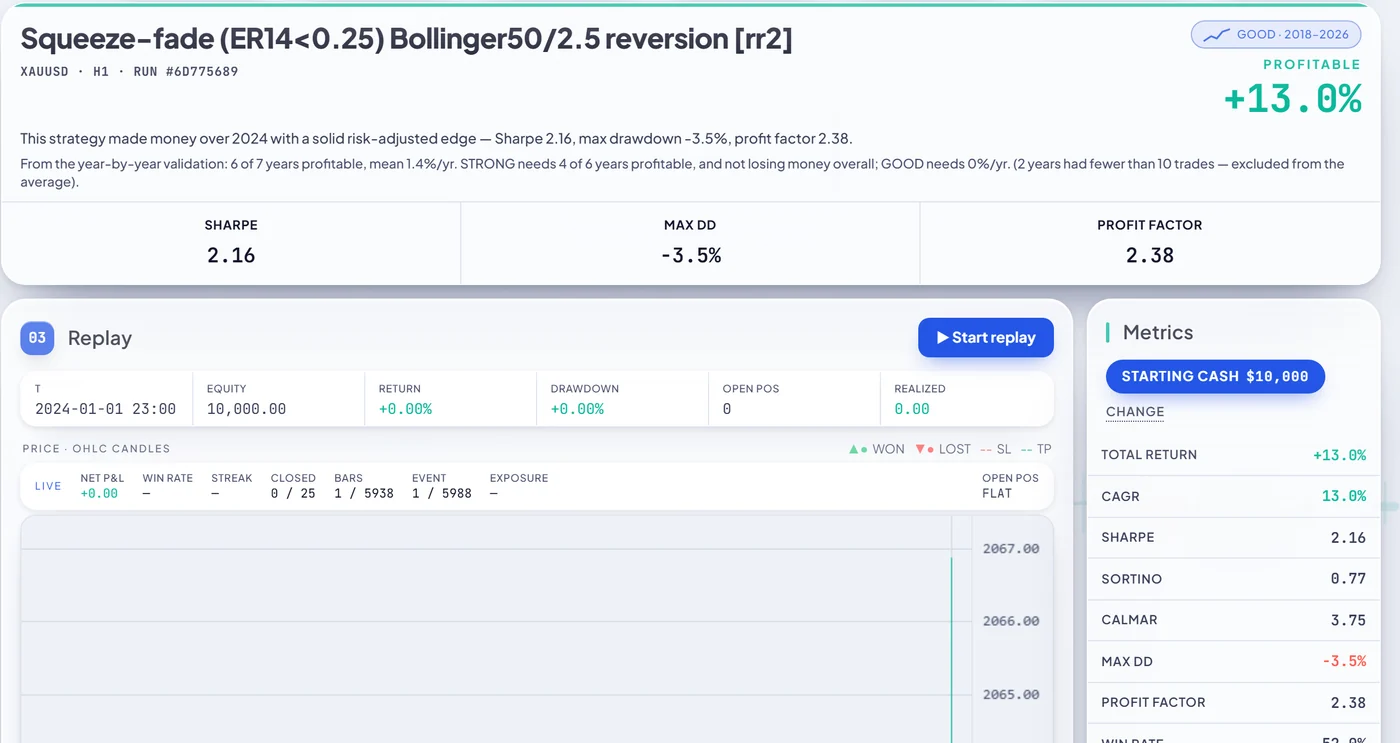
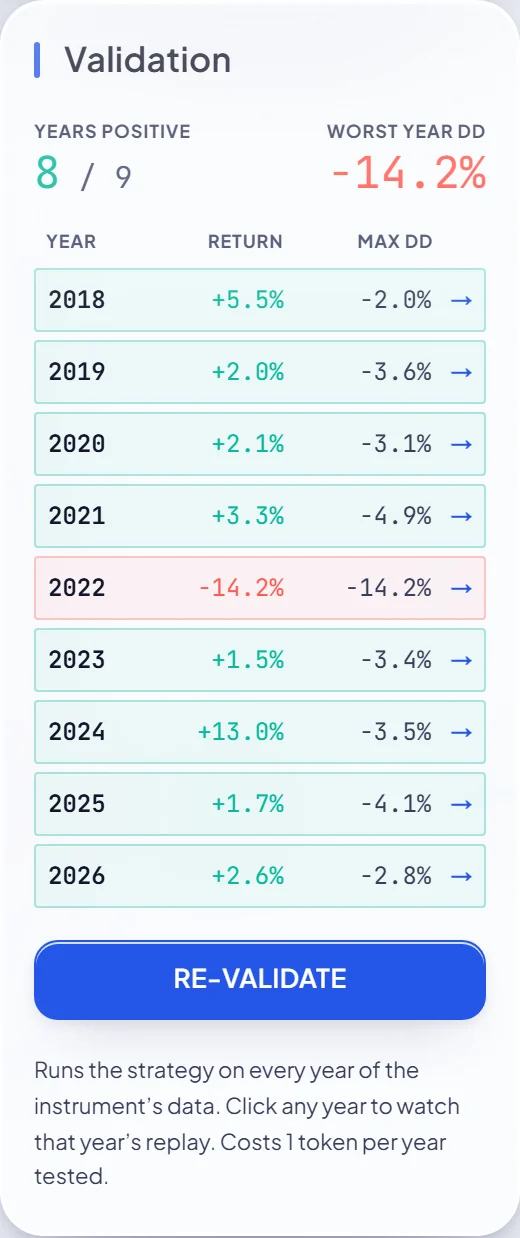
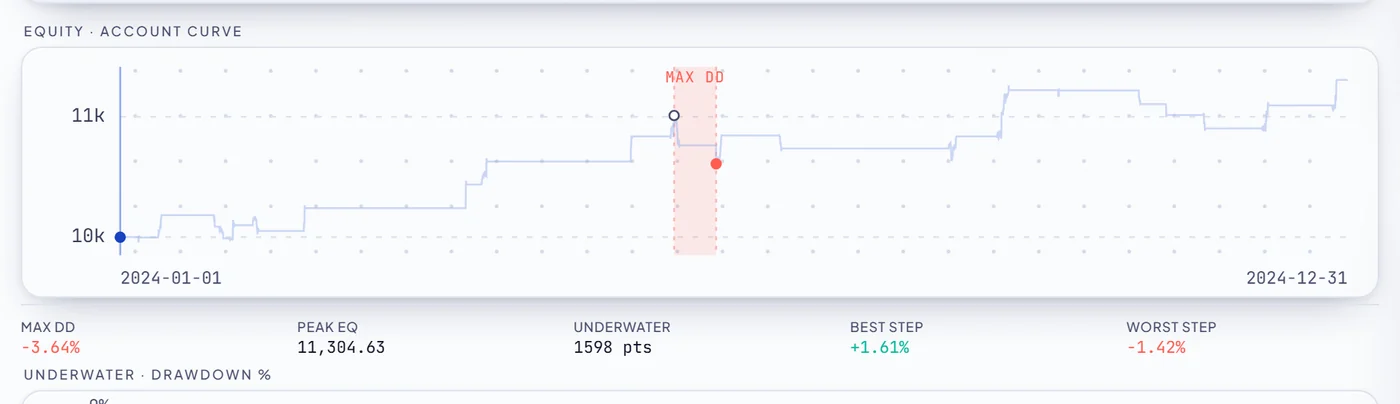
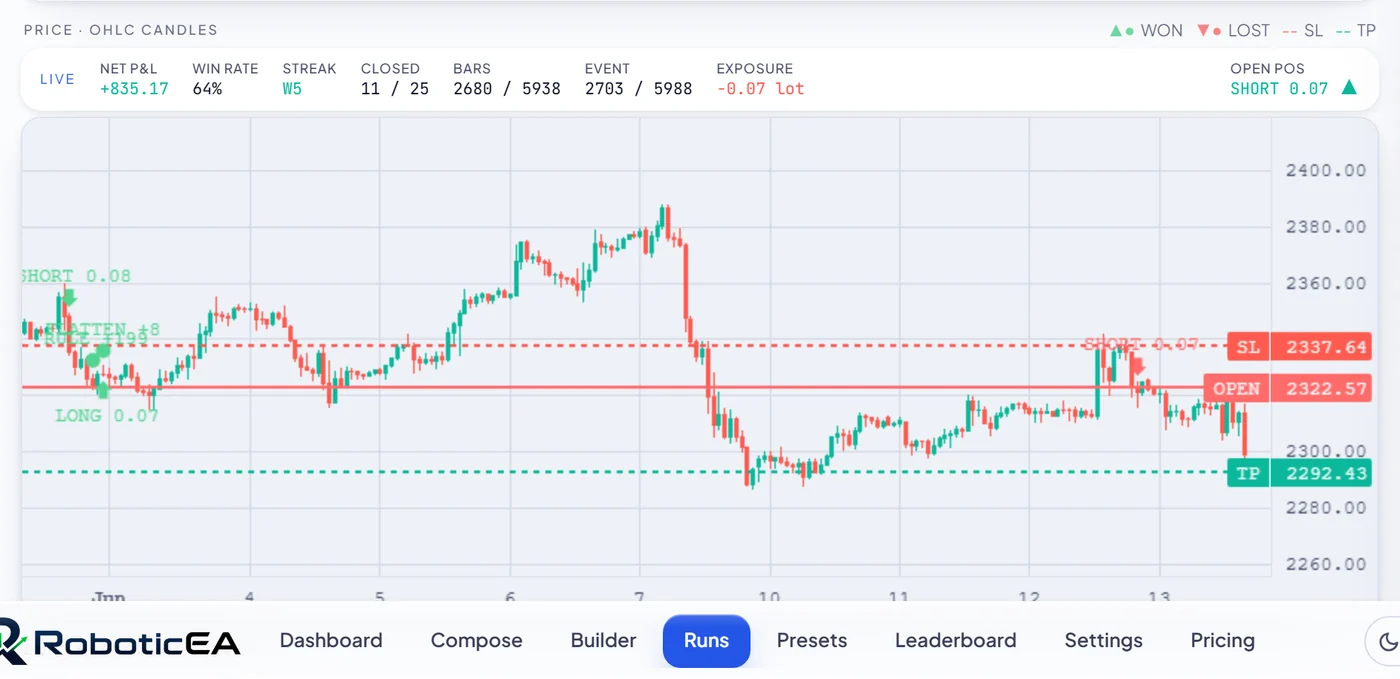
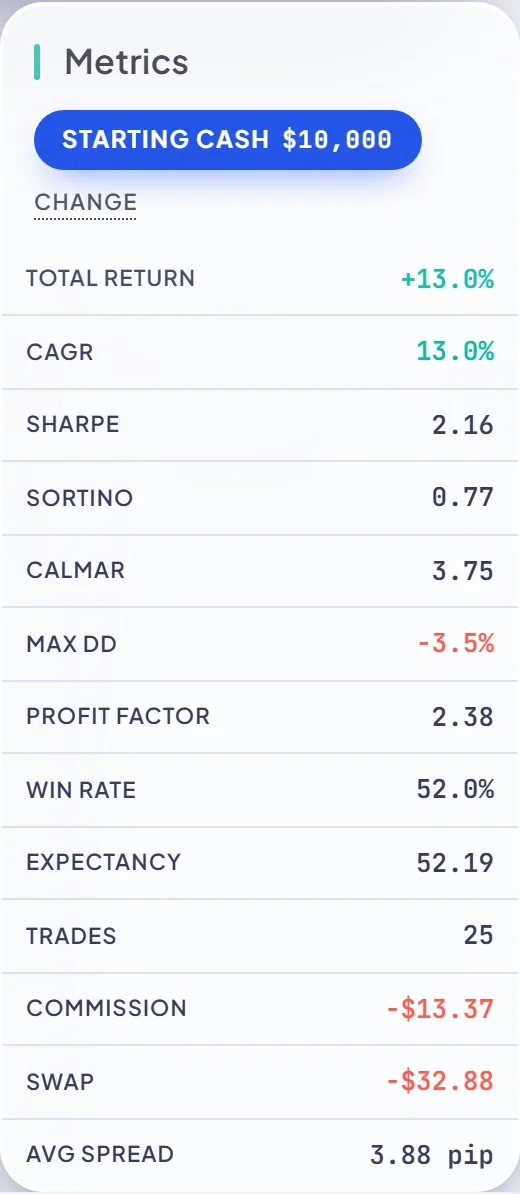
Here is a gold strategy from the sample opened in RoboticEA — an H1 squeeze-fade on XAUUSD. This is the flattering case, and it is still a long way from a sales page:
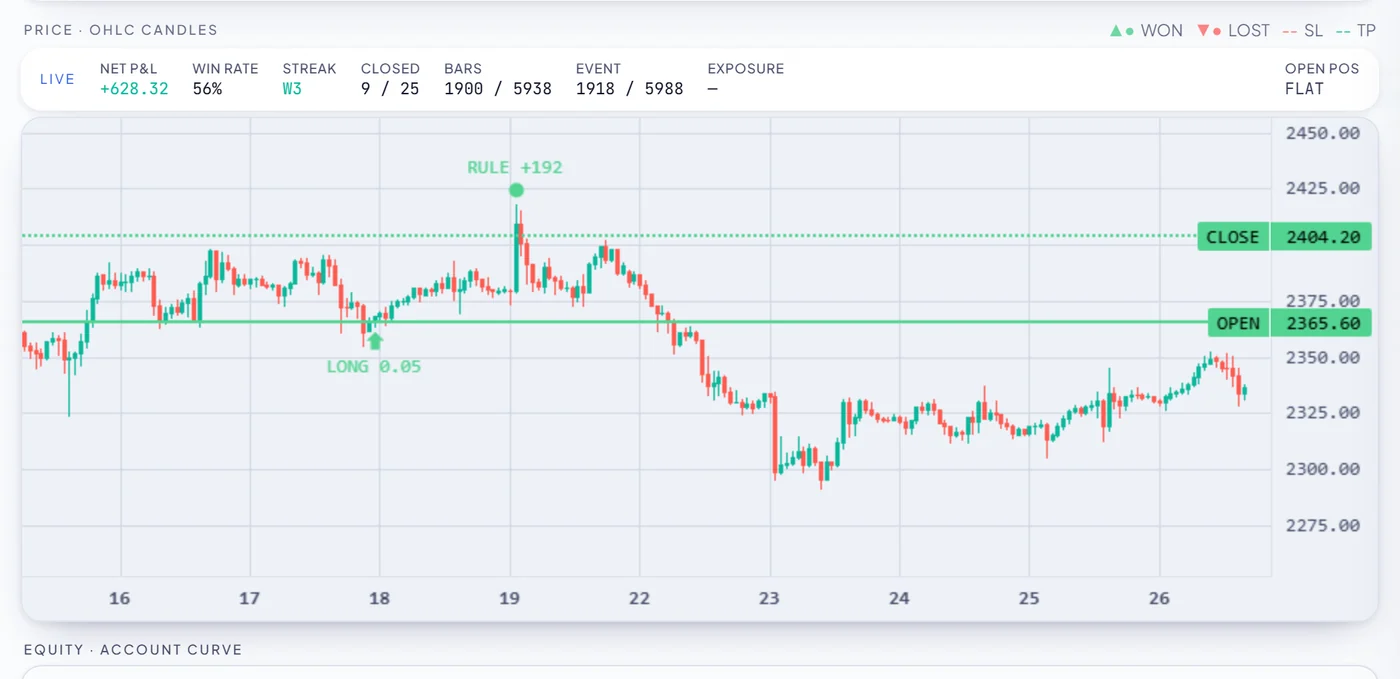
And because a yearly figure still says nothing about behaviour, the same run replays bar by bar on the real gold candles — entries, exits, stop and target lines, with the equity curve building underneath:
Test a gold strategy on your own terms
Every instrument, timeframe and year in this study is in the product. Free account, no card, and MetaTrader 5 export is included.
The real cost
What gold’s spread really costs — measured three ways
This is the part that decides whether any gold EA result you are shown is worth reading. We re-ran the identical 15,728 cells under three cost models — matched cell for cell, so nothing changes except what the trade is charged.
| Cost model | Median year | Years positive | Positive mean | Profitable all 8 |
|---|---|---|---|---|
| Real recorded spreadgold’s own per-bar spread + commission + swap | -38.5% | 17.4% | 172 | 0 |
| Flat 1 pipthe “realistic retail” approximation | -21.3% | 25.9% | 380 | 0 |
| Zero costfrictionless | -6.1% | 40.6% | 998 | 10 |
10 → 0
strategies "profitable every year for 8 years", with the spread off and on
Switch the spread off and 10 gold strategies appear with a perfect 8-year record. Charge gold's real recorded spread on the same runs and there are none. Nothing about the strategies changed.
Per cell, understating the spread as a flat pip flattered the result by a median of +9.12% a year, and 1,356 cells — 8.6% of them — were profitable only because of it. Remove friction entirely and the median gap grows to +21.75% a year with 3,658 cells (23.3%) flipping to a profit they never earned.
This is why our engine requires the real-spread model for gold and metals rather than offering it: a fixed one-pip spread is a defensible simplification on EURUSD and a fiction on XAUUSD, where the recorded spread averaged 3.81 pip across this sample.
Gold’s spread bill has roughly tripled since 2018
One more thing the per-year data exposes. The median spread our runs paid was 2.44 pip in 2018 and 6.64 pip in 2025. As gold’s price climbed, the spread in pips climbed with it. A backtest whose window stops a few years ago is not merely out of date — it is charging materially less than gold costs to trade today.
Timeframe
The best timeframe for a gold EA
This came out cleaner than anything else in the study, and it is the most actionable result here. Sorted by how often a year came out positive, the ranking is monotonic in timeframe:
| TF | Median year | Years positive | Median trades/yr | Avg spread | 6+ of 8 |
|---|---|---|---|---|---|
| M5 | -99.7% | 0.0% | 592 | 3.53 pip | 0 |
| M15 | -89.0% | 4.4% | 501 | 3.72 pip | 1 |
| M30 | -64.2% | 6.4% | 292 | 3.74 pip | 0 |
| H1 | -31.1% | 18.7% | 161 | 3.81 pip | 3 |
| H4 | -3.9% | 37.9% | 39 | 4.05 pip | 18 |
The mechanism is right there in the last two columns. Gold’s spread is roughly the same on every timeframe — about 3.81 pip — because it is a property of the instrument, not of your chart. What the timeframe decides is how many times a year you pay it. At 592 trades a year, M5 pays that toll 15 times more often than H4 does, against price moves that are no bigger in proportion. The median M5 strategy on gold finished the year at -99.7% — effectively a destroyed account — and not one M5 strategy-year in the sample was profitable.
So: on gold, slower is better, and the effect is enormous. H4 was the best of the intraday timeframes at 37.9% of years positive, and it holds 18of the study’s consistent strategies. Daily bars, tested over one wide window rather than per year, land in similar territory: -3.7% median over 2018-01-01..2026-06-30 on 92 trades, with 34.3%of strategies positive — though gold’s spread on D1 is wider still at 5.90 pip, because a daily strategy tends to act at the session open where the spread is at its worst. This is not a gold peculiarity: the same ranking, in the same order, appears on EURUSD — and switching the costs off collapses it, which is what identifies it as a cost effect rather than a skill effect.
The practical read: be extremely sceptical of a gold scalping EA. It is the category with the highest spread bill per unit of edge, and it is the category where our sample found nothing that worked.
Window selection
Why the years you pick decide everything
Run the same 1,966strategies year by year and the “quality” of gold as a market swings wildly:
| Year | Median return | Strategies positive | Median DD | Avg spread |
|---|---|---|---|---|
| 2018 | -56.8% | 6.5% | -64.1% | 2.44 pip |
| 2019 | -50.7% | 7.0% | -60.3% | 3.03 pip |
| 2020 | -26.4% | 24.6% | -49.4% | 5.35 pip |
| 2021 | -47.5% | 10.1% | -60.5% | 3.75 pip |
| 2022 | -38.0% | 15.9% | -53.3% | 3.84 pip |
| 2023 | -34.5% | 19.7% | -56.8% | 3.51 pip |
| 2024 | -32.5% | 21.7% | -50.0% | 3.91 pip |
| 2025 | -16.7% | 33.5% | -43.8% | 6.64 pip |
| 2026 (partial) | -5.4% | 36.7% | -29.8% | 8.48 pip |
In 2018, 6.5% of gold strategies made money. In 2025, 33.5% did. Those are the same strategies. If someone shows you a gold EA validated on the last two years, they have chosen the two kindest years in nearly a decade — and if they show you one validated on 2018–2019, it is a considerably stronger claim than it looks.
This is the whole reason our per-year validation exists and is on by default. One number over one window is not evidence; a row of years with the losses left in is.
Practical
How to judge any gold EA you are offered
You do not need our software to apply this. Six questions, in the order that eliminates fastest:
- What spread was charged, in pips? If the answer is not a number near 3.81 pip, or is not given at all, stop. On our data this single variable moved 23.3% of results across the profit line.
- Show me every year separately. Not a compounded curve — a row per year with the losers visible. Ask specifically for 2018 and 2019.
- How many trades per year?Under about 20 and the record is noise, however pretty. Several of our most “consistent” strategies were consistent only because they hardly traded.
- What is the max drawdown, next to the return? A return quoted without its drawdown is not a result.
- Is swap modelled? Gold carries a real overnight financing cost, and a strategy that holds positions through Wednesday pays it triple.
- Can I read the source? If the EA arrives as a compiled
.ex5you cannot inspect, you are trusting the seller’s backtest and nothing else — which is the whole problem with free EA downloads.
FAQ
Gold EA questions, answered
What is the best gold expert advisor for MT5?
There is no gold EA you can buy and trust, but gold can be traded systematically. We backtested 1,966 strategies on XAUUSD across the eight full years from 2018 to 2025 at 3% risk per trade with gold's real recorded spread charged. The best turned $10,000 into a compounded +162%, about +21.2% a year — while losing money in 3 of the 8 years, drawing down -61.0%, and taking 49% of all its gains in a single year. That is what a real gold edge looks like: large, lumpy and hard to hold. Judge any specific EA by asking for a compounded year-by-year record with real spread charged and the drawdown stated.
Can a gold EA really average 20-25% a year?
Yes, at a realistic risk setting, and two things have to be said with it. At 3% risk per trade, 172 of 1,966 strategies had a positive mean year, 12 averaged 10% or better and 2 averaged 25% or better; at 4% risk, 6 did. But the arithmetic mean of yearly returns is a misleading measure: of the eight highest-averaging strategies in our sample, six compounded negative, and one finished at -100% — the account gone — while still averaging +13.2% a year. Ask what the balance did over the whole period, not what the years averaged.
What risk per trade should a gold EA use?
Risk per trade changed our results more than the choice of strategy did, and it widens the distribution rather than improving it. Running the identical 1,966 strategies at 2%, 3% and 4%: the best mean year rose from +20.5% to +45.4% to +87.4%, and the number of strategies averaging 25% or better went from 0 to 2 to 6. Over the same range the median year fell from -25.9% to -38.5% to -50.5%, the median maximum drawdown deepened from -39.7% to -66.2%, and the share of years ending with the account wiped out rose from 0.17% to 1.70%. More risk buys a bigger top and a worse middle.
Is XAUUSD good for automated trading?
Gold is harder than a major currency pair for one measurable reason: its spread is much wider. Across our study the recorded spread averaged 3.81 pips per trade, against roughly one pip on EURUSD, and it has widened as gold's price has risen — from 2.44 pips in 2018 to 6.64 pips in 2025. Gold can be traded systematically, but a strategy has to earn considerably more per trade to clear the cost, which rules out most high-frequency approaches.
What is the best timeframe for a gold expert advisor?
The slower the better, and the effect is large. At 3% risk, 37.9% of H4 strategy-years finished positive on a median year of -3.9%, against 18.7% on H1, 6.4% on M30, 4.4% on M15 and 0.0% on M5. The reason is that gold's spread is roughly the same on every timeframe — 3.5 to 4.1 pips — so the timeframe decides how often you pay it: the median M5 strategy took about 592 trades a year against 39 on H4. Daily bars, tested over one wide window, landed near H4 with 34.3% of strategies positive.
Why do gold EA backtests look so much better than live results?
Most often because the backtest did not charge gold's real spread. We re-ran the same 15,728 yearly backtests under a flat one-pip spread and 1,356 of them — 8.6% — turned profitable purely because of the cheaper assumption, with a median improvement of 9.1 percentage points a year. With costs removed entirely, 3,658 cells (23.3%) flipped to profit, and 10 strategies appeared with a perfect eight-year record where the real recorded spread produces none at all.
How much drawdown should I expect from a gold EA?
More than most vendors show, and it scales with your risk setting. At 3% risk the median maximum drawdown across all our gold backtests was -54.5%, and 0.78% of strategy-years ended in a total loss of the account. Even the best-compounding strategy we found, which turned $10,000 into +162% over eight years, drew down -61.0% on the way and had a -38.1% year. A gold EA advertised without its drawdown is not showing you a result.
Is a gold scalping EA a good idea?
Our data argues strongly against it. Scalping means many trades, and on gold every trade pays a spread of roughly 3.8 pips. The fastest timeframe we tested, M5, had a median yearly result of -99.7% and not a single profitable strategy-year out of 1,200. The spread bill on gold rises directly with trade frequency while the edge per trade does not.
Everything above is reproducible: 88,770 runs, engine build 0.2.0, seed 20260817, $10,000 per run, on real market bars. The same instruments, timeframes and years are in the product, so you can run the parts of it you doubt — here is how the whole workflow fits together.
Keep reading
Does our engine agree with MetaTrader 5?
Run for run against MT5's own Strategy Tester on real ticks — the study behind every number above.
594,580 backtests across 34 archetypes
The companion study on EURUSD, and the dimension that turned out to decide more than strategy choice.
Do forex robots work?
The same question asked of the whole population rather than one instrument — four studies, and the honest answer.
The best timeframe for an expert advisor
Why slower was better on gold, tested on EURUSD: the ranking is a cost effect, and it collapses when costs come off.