

Data study
Best forex EA: what 13.7 million backtests say about picking one
 Tommy J.Founder, RoboticEA
Every “best forex EA” list ranks robots by their backtest. We wanted to know whether that ranking means anything, so we pulled together six of our own studies — 13.7 million backtests across forex majors, crosses, gold and indices, each one on real recorded market bars with the spread charged inside the simulation — and asked two questions: does picking the top of a backtest leaderboard work, and what do the strategies that kept working actually have in common?
The short answer
The honest answer
Is there a best forex EA?
Not in the way the question is usually meant. “Best” assumes a forex expert advisor is a product you can rank, like a laptop: test them all, sort by return, buy the one at the top. Our data says the sort itself is the problem. A backtest ranking mostly measures which strategies happened to fit a particular stretch of history on a particular instrument, and that fit does not carry forward.
That does not mean systematic trading is hopeless. Across these studies a small minority of strategies did keep their shape across years, and they were not random: they share a timeframe, a trade frequency, a risk level and a drawdown profile. That profile is the most useful thing we can tell you, because you can check any EA against it — ours, a free one, or one you are about to pay for.
This page is the hub over our per-instrument and per-dimension studies. Each section below summarises one finding and links to the full write-up, where the method, the tables and the caveats live.
Sources
Six studies, one question
These were run at different times, on different populations, for different reasons, which is exactly why their agreement means something. Every run used our own C++ engine on real recorded bars, with spread, commission and swap charged as each trade happened.
| Study | Backtests | What it measured | Full write-up |
|---|---|---|---|
| Timeframe study | 33,100 | 2,050 EURUSD strategies, M5 to H4, each year separately, with costs on and off | Best timeframe |
| Instrument study | 73,250 | The same strategies on all 25 instruments, 2018–2025 | Best pairs |
| Robots study | 55,265 | A 25-instrument matrix plus two selection holdouts (by instrument and by year) | Do robots work? |
| Gold study | 186,637 | 4,961 XAUUSD strategies, 8 full years, three cost models | Best gold EA |
| EURUSD discovery | 8,098,335 | A strategy search plus an unfiltered pool, scored walk-forward on years after the pick | Best EURUSD EA |
| GBPUSD transplant | 5,298,129 | 215,727 gold-selected strategies re-run on GBPUSD | Best GBPUSD EA |
The core finding
Why the top of a forex EA leaderboard is the wrong place to look
The chart at the top of this page is the single most important result we hold. Three different designs, two instruments, the same outcome: the higher a group ranked on the years it was picked on, the further it fell afterwards. On EURUSD the top 10 went from +961% to −52%, the top 100 from +341% to −47%, and the whole badged pool — far less impressive on paper at +22% — lost only 11%. The ordering is upside down.
The reason is not fraud and not a bug. A ranking by in-sample return sorts by two things at once: genuine edge, which is small, and luck, which in a large population is large. The further up the ranking you go, the more of the result is luck — and luck does not repeat. GBPUSD shows the same pattern from cable’s own history: its top 10 picked on 2018–2023 compounded +638% there and −63% over 2024–2025, when the median strategy in the eligible pool did −11%.
Moving the instrument is the same test
The other way to check a ranking is to keep the years and change the market. In the robots study the top 25 strategies by in-sample return went from +15.25% on their home instrument to −18.27% across 12 others (H1). In the GBPUSD transplant the 1,000 best strategies by gold’s compounded return were profitable on cable 10.3% of the time — against 12.5% for the whole pool. Being a top gold strategy was, if anything, a slight handicap.
What this looks like in the app
A leaderboard sorted by return for a single year is the same ranking in miniature. Here is our app’s leaderboard for one account’s saved EURUSD H4 strategies in 2025, sorted by return:
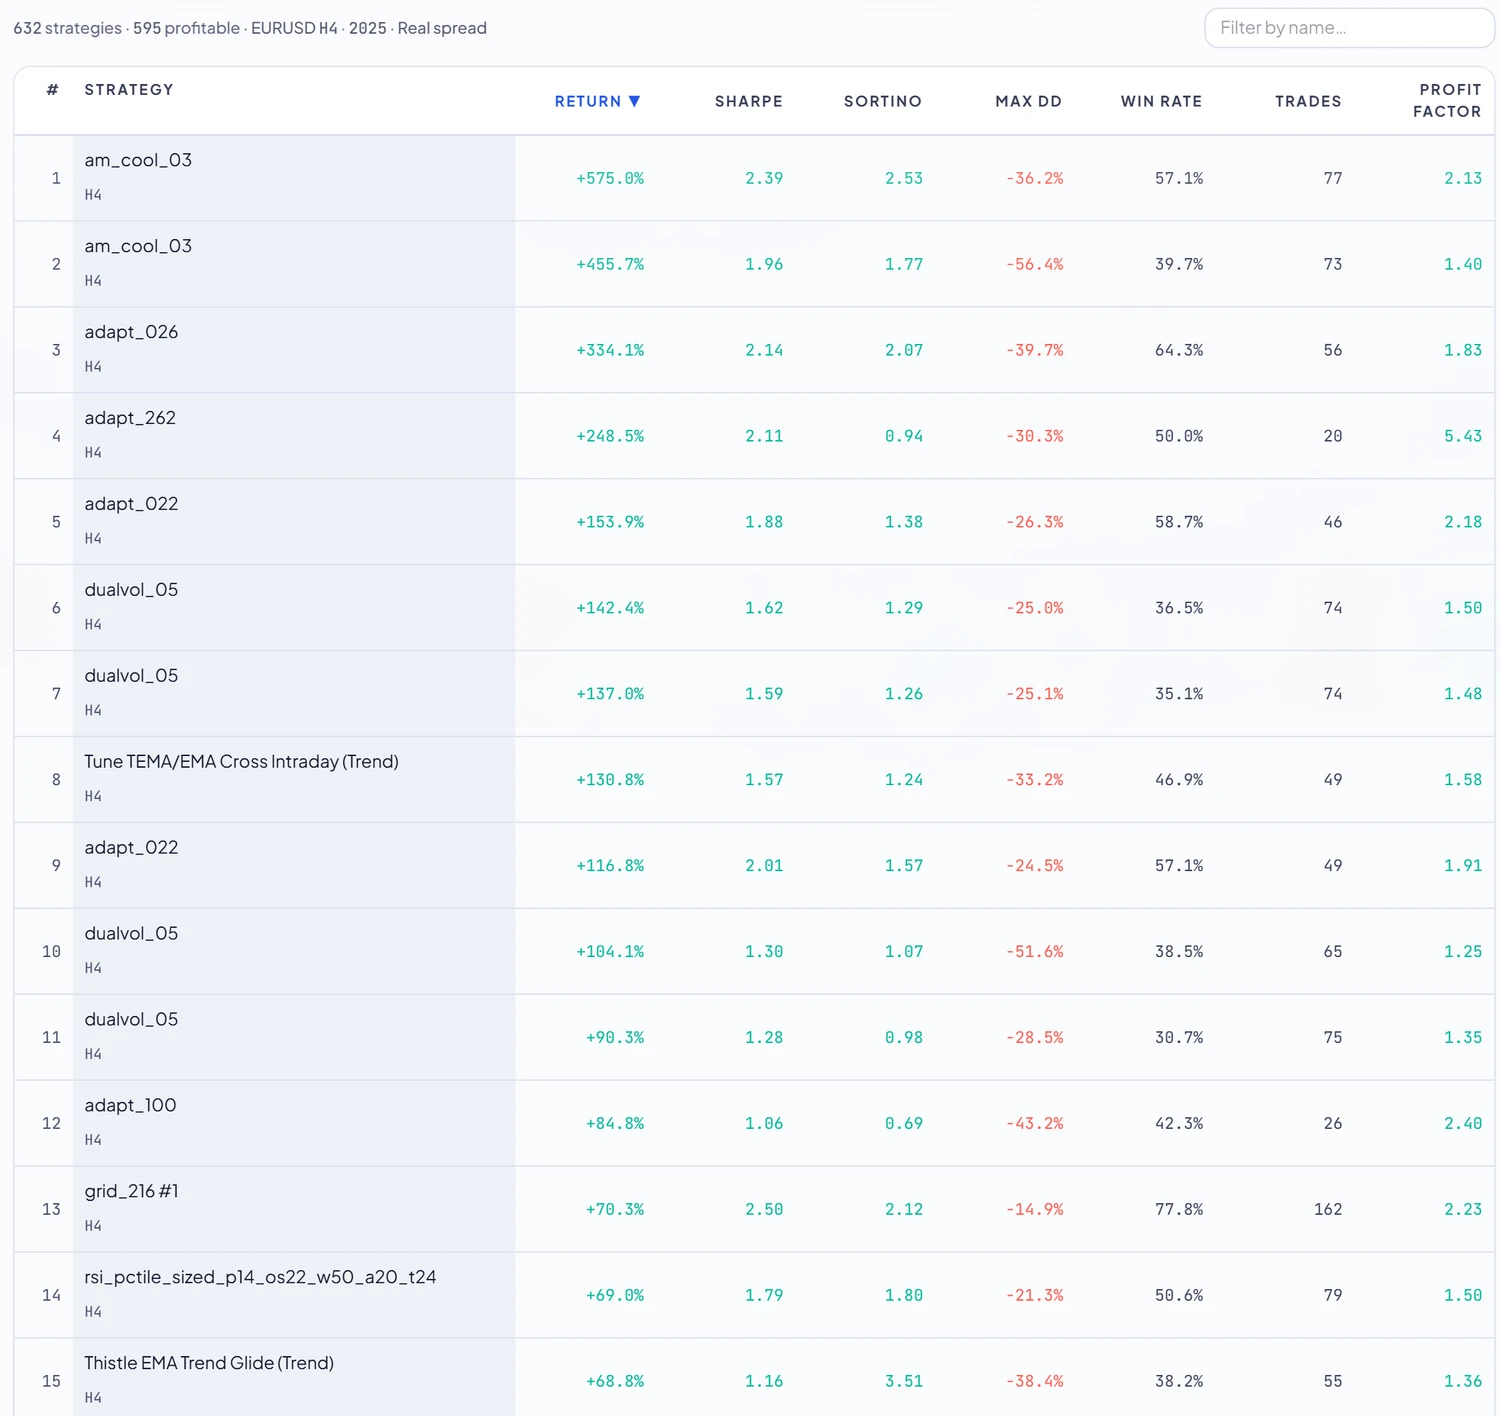
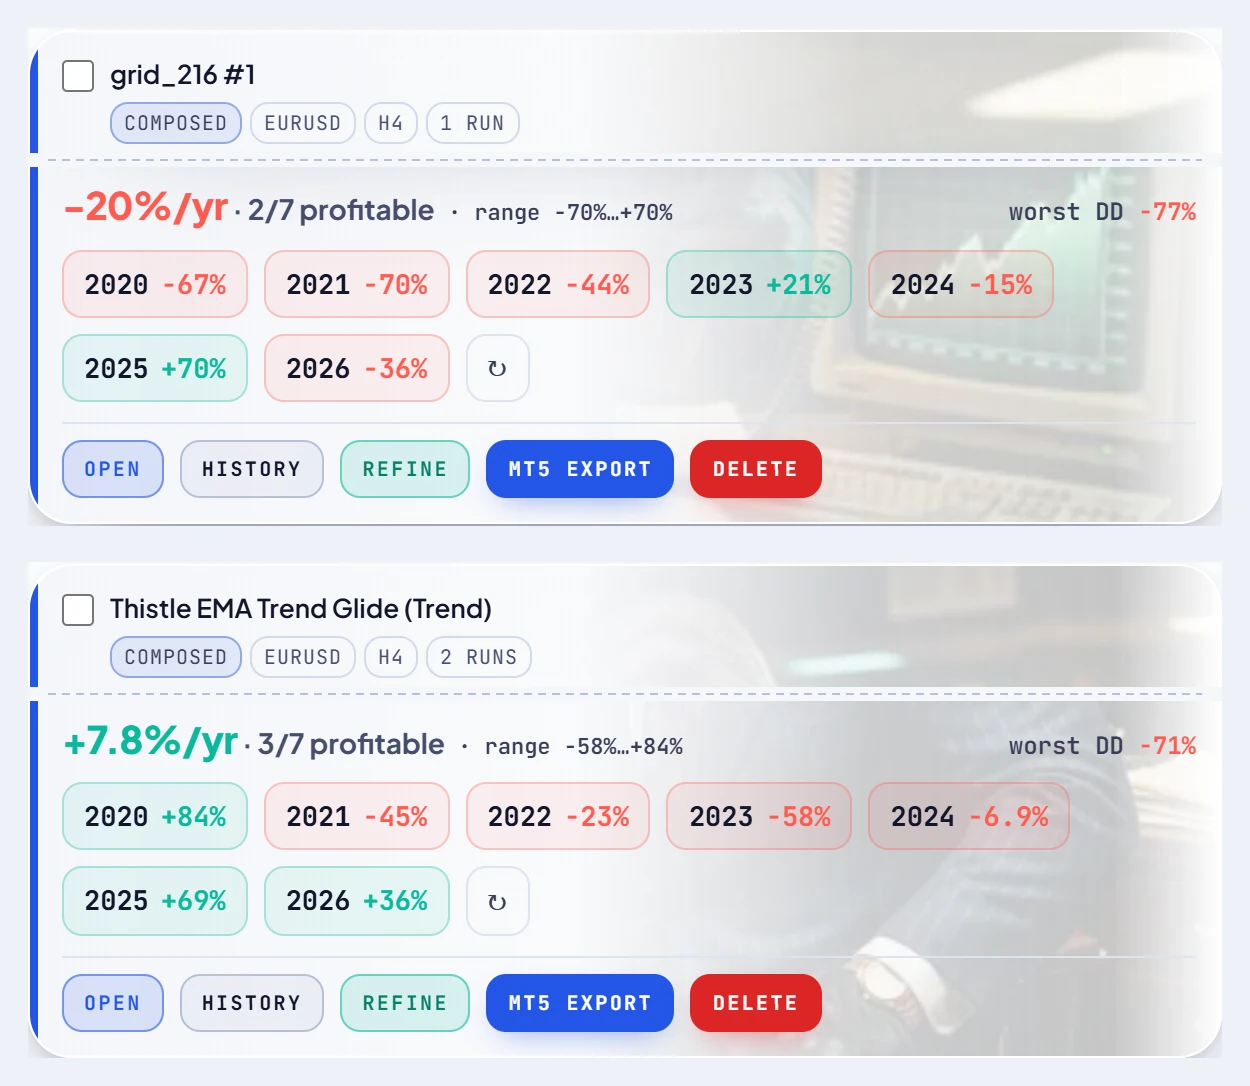
Rows 13 and 15 both made about 70% in 2025. Open their cards, which re-run every year separately, and the ranking falls apart:
8 of 8
of the highest-averaging gold strategies compounded to a wiped-out account
Ranked by the arithmetic mean of their yearly returns, the top 8 gold strategies look spectacular — the leader averaged +368% a year. Compounded over the 8 full years, it went to −100%. One enormous year inflates a mean; it cannot rescue a balance that hit zero first.
That is the second ranking trap, and it is why every return on this page is compounded. An “average annual return” on an EA sales page can be arithmetically true and describe an account that no longer exists. Ask what the balance did over the whole period. The full analysis of both traps is in the EURUSD walk-forward and the GBPUSD transplant.
The profile
What a forex EA that holds up looks like
If ranking by return does not find a good EA, what does the small set of strategies that kept working have in common? Four things recur across the studies, and none of them is the entry signal.
H4 / H1
the only timeframes any EURUSD survivor came from
67
median trades a year among those survivors
≤ 2%
risk per trade of every survivor that states one
−22%
their median worst drawdown
1. A slow timeframe — usually H4
Of 2,050 EURUSD strategies tested on each of 8 years, 0.2% of M5 strategy-years were profitable against 37.9% on H4. Only 13 strategies made money in six or more of the 8 years, and of the 11 that also traded at least 20 times every year, 6 were H4 and the rest H1. On gold, 6 of the 8 most consistent strategies were H4. On GBPUSD, 16.4% of H4 strategies were profitable over eight years against 6.4% of H1. And in the EURUSD walk-forward, badged H4 strategies were profitable after the pick 37.8% of the time, H1 18.5%.
Daily bars are defensible but slow to judge: 74.7% of D1 strategies could not reach 20 trades in a single year, so a D1 record takes many years to mean anything. The why, and the full table, is in the best timeframe for expert advisors.
2. Tens of trades a year, not hundreds
Timeframe matters mostly because of what it does to trade count, and trade count matters because the spread is charged on every trade. On EURUSD the median M5 strategy traded 1,075 times a year and costs took 44.1% of the account a year; the median H4 strategy traded 35 times and costs took 1.6%. Switch costs off and 29.5% of M5 strategy-years flip to a profit they never earned. A scalping EA is not necessarily wrong about the market — it is paying a toll on hundreds of trades a year that a slower EA pays a few dozen times.
The floor matters too: a strategy with five trades a year has no record at all, however good it looks. That is why our app will not issue a verdict on a year with fewer than 20 trades.
3. Low risk per trade, and a drawdown you could sit through
Risk per trade does not add edge; it widens the outcome in both directions. The EURUSD walk-forward tested the identical 8,635 strategies at three risk levels and scored them on 2024–2026:
| Risk per trade | Median, picked years | Median, years after | Profitable after | Median worst-year DD after |
|---|---|---|---|---|
| 2% | +14.4% | −6.0% | 34.7% | −16.6% |
| 3% | +18.6% | −9.9% | 32.8% | −24.1% |
| 4% | +21.1% | −14.3% | 31.1% | −31.1% |
The survivors bear this out: every EURUSD survivor that states a risk setting used 1–2% per trade, with a median worst drawdown of −21.8%. An EA advertising a big return at 5% or 10% risk per trade is showing you the top of a very wide distribution, not an edge.
4. An instrument that is cheap to trade — but no “best pair”
Across 25 instruments the share of profitable strategy-years ranged from 11.7% (FX cross) to 24.0% (index). No class came close to half. The bigger difference was cost: friction took 5.8% of the account a year on US30 and 22.3% on AUDNZD. But a “best pair” ranking does not transfer either — among H1 and H4 strategies the rank correlation between two instruments was a median ρ = 0.40, and the strategies that were best on an instrument went from +2.6% at home to −5.6% elsewhere. More in the best forex pairs for expert advisors.
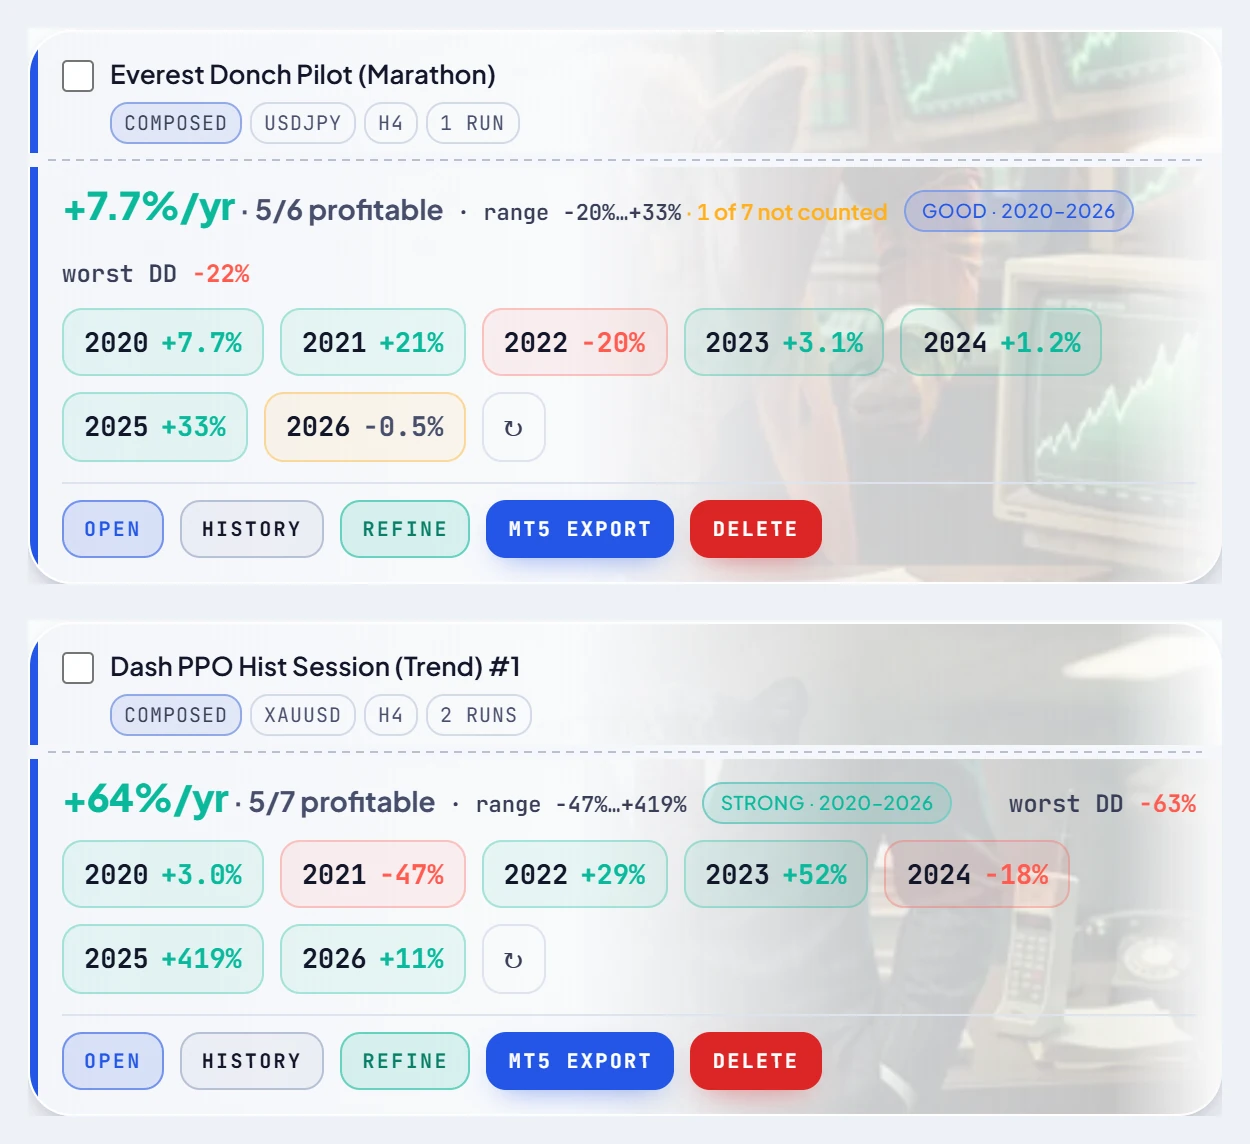
Check a strategy against the profile
RoboticEA re-runs every strategy on each year separately with real recorded spread, shows trades, drawdown and the losing years, and exports to MetaTrader 5. Free account, no card.
Expectations
What good looks like, compounded
Once you stop ranking by the top of the distribution, the realistic numbers are much smaller — and much more honest. On gold, the most consistent strategies we found compounded as follows over 8 full years with real spread:
| Strategy | TF | Compounded | Years up | Worst DD | Trades/yr |
|---|---|---|---|---|---|
| Trend Confirmation | H4 | +31.6% | 6 / 8 | −15.4% | 33 |
| Orderflow | H4 | +56.6% | 6 / 8 | −22.8% | 44 |
| Volatility Squeeze | H1 | +59.3% | 6 / 8 | −29.1% | 109 |
| Multi-Step | M30 | +60.7% | 6 / 8 | −46.5% | 57 |
| Cycle | H4 | +13.5% | 5 / 8 | −17.7% | 33 |
| Regime | H4 | +13.7% | 5 / 8 | −22.3% | 48 |
| Orderflow | H4 | +42.3% | 5 / 8 | −19.8% | 43 |
| Oscillator | H4 | +26.1% | 5 / 8 | −14.7% | 40 |
Compare the best compounded result in the whole gold study: +175% over 8 years, which is a real and large number — achieved while losing money in 4 of the 8 years and drawing down −57.8%. That is the honest shape of a high-return EA: lumpy, and very hard to hold through. The full story, including what gold’s spread does to it, is in the best gold expert advisor for MT5.
So when an EA claims triple-digit returns every year with a single-digit drawdown, the question is not whether it is the best EA. It is which of the traps above produced the number.
By market
The best expert advisor by market: where to read next
- Gold (XAUUSD). A median recorded spread of 3.8 pips, charged on every trade. With costs off, 24.0% of gold strategy-years flip to a profit they did not earn. Best gold EA for MT5 →
- EURUSD. The most-traded pair, and the cleanest walk-forward test we have: the top 10 picks fell from +961% to −52%. Best EURUSD expert advisor →
- GBPUSD. Strategies that worked on gold, moved to cable: the median one compounded −38% over eight years. Best GBPUSD expert advisor →
- Choosing a pair at all. All 25 instruments, what each charges a strategy, and why a league table of pairs does not travel. Best forex pairs for EAs →
- Choosing a timeframe. M5 to D1, with costs on and off — the biggest single lever in this whole page. Best timeframe for EAs →
- Whether any of it works. The population-level view, the cost experiment and both selection holdouts. Do forex robots work? →
Practical
How to judge any MT5 EA before you run it
You do not need our software for this. Whether the forex expert advisor is free, bought, or built yourself, these questions are ordered so the cheapest eliminations come first.
- Was it picked on the years it is advertised with? If the backtest window is also the selection window, you are looking at the left-hand dots in the chart above. Ask for results on years — or instruments — it was not chosen on.
- Is the return compounded? An average of yearly returns can belong to an account that went to zero: 8 of the 8 highest-averaging gold strategies did.
- What spread and commission were charged? If the answer is not a number, stop. Turning costs off flipped 24.0% of gold strategy-years into profit.
- Show me every year separately, losers included. A per-year record cannot be window-shopped; one compounded curve can.
- At least 20 trades in every year? Below that, a good year is as likely to be chance as skill.
- What timeframe, and how many trades a year? Hundreds of trades a year on M5 or M15 means paying the spread hundreds of times. Every EURUSD survivor was H4 or H1.
- What risk per trade, and what drawdown? A return without its drawdown is half a number, and a return at high risk is the tail of a wide distribution. The profile that held up was 1–2% risk with a worst drawdown around −22%.
- Can you read it? A compiled
.ex5you cannot inspect asks you to trust the seller’s backtest and nothing else. Prefer MQL5 source, or at least visible inputs — and re-run it yourself in the MT5 Strategy Tester on real ticks (why real ticks matter).
An EA that answers all eight may still lose money — every figure here is a backtest. But one that answers none is not a strategy; it is a screenshot.
Limits
What this does not tell you
- Everything here is simulation. We hold no live trading record. A strategy that fits the profile can still lose money from the day it goes live.
- The profile is descriptive, not a recipe. H4, few trades and low risk describe what survived; they do not make a strategy profitable. Most H4 strategy-years lost money too — the median H4 strategy-year on EURUSD was −1.8%.
- The survivor lists are in-sample. The EURUSD survivors and the consistent gold strategies were chosen on the years they are scored on. The out-of-sample evidence is the walk-forward and transplant results, and those say selection is hard.
- Holdouts disagree with each other sometimes. In the robots study 3 of 4 time-holdout cells went negative, and one split of four pointed the opposite way to the rest. One split is not a holdout.
- Selection methods beyond ranking are untested at this scale. We have shown that ranking by in-sample return fails. We have not shown that nothing works.
FAQ
Questions, answered
What is the best forex EA?
There is no forex EA you can identify as the best from its backtest. In our EURUSD walk-forward, the ten best strategies picked on 2018–2023 had compounded a median +961%; over 2024–2026 the same ten compounded to a median −52%. The same collapse showed up on GBPUSD and on gold strategies moved to GBPUSD. What held up across years had a recognisable profile instead: a slow timeframe (H4), a few dozen trades a year, 1–2% risk per trade and a worst drawdown around −22%. Judge any EA against that profile and an honest per-year record, not its rank.
Why do top-ranked expert advisors fail after you buy them?
Because a ranking by backtest return sorts by edge and luck at once, and the higher you go the more of the result is luck. In our data the higher a group ranked on the years it was picked on, the further it fell afterwards. Moving the instrument has the same effect: the 1,000 best strategies by gold's compounded return were profitable on GBPUSD 10.3% of the time, against 12.5% for the whole pool.
Is an EA's average annual return a good way to compare EAs?
No. An average of yearly returns can belong to an account that went to zero. Ranked by the mean of their yearly returns, all 8 of the 8 highest-averaging gold strategies in our study compounded to a wiped-out account, including one that averaged +368% a year. Always ask for the compounded result over the whole period, year by year.
What is the best timeframe for a forex EA?
Slower timeframes held up far better, mainly because they trade less and so pay the spread less often. On EURUSD, 37.9% of H4 strategy-years were profitable against 0.2% on M5, and every EURUSD strategy that was profitable in six or more of eight years while trading at least 20 times a year was H4 or H1.
How do I check an MT5 EA before running it?
Ask whether it was tested on years or instruments it was not picked on; whether the return is compounded; what spread and commission were charged (turning costs off flipped 24.0% of gold strategy-years into profit); for every year separately, losers included; for at least 20 trades in every year; for the timeframe, risk per trade and maximum drawdown; and whether you can read the code. Then re-run it yourself in the MT5 Strategy Tester on real ticks.
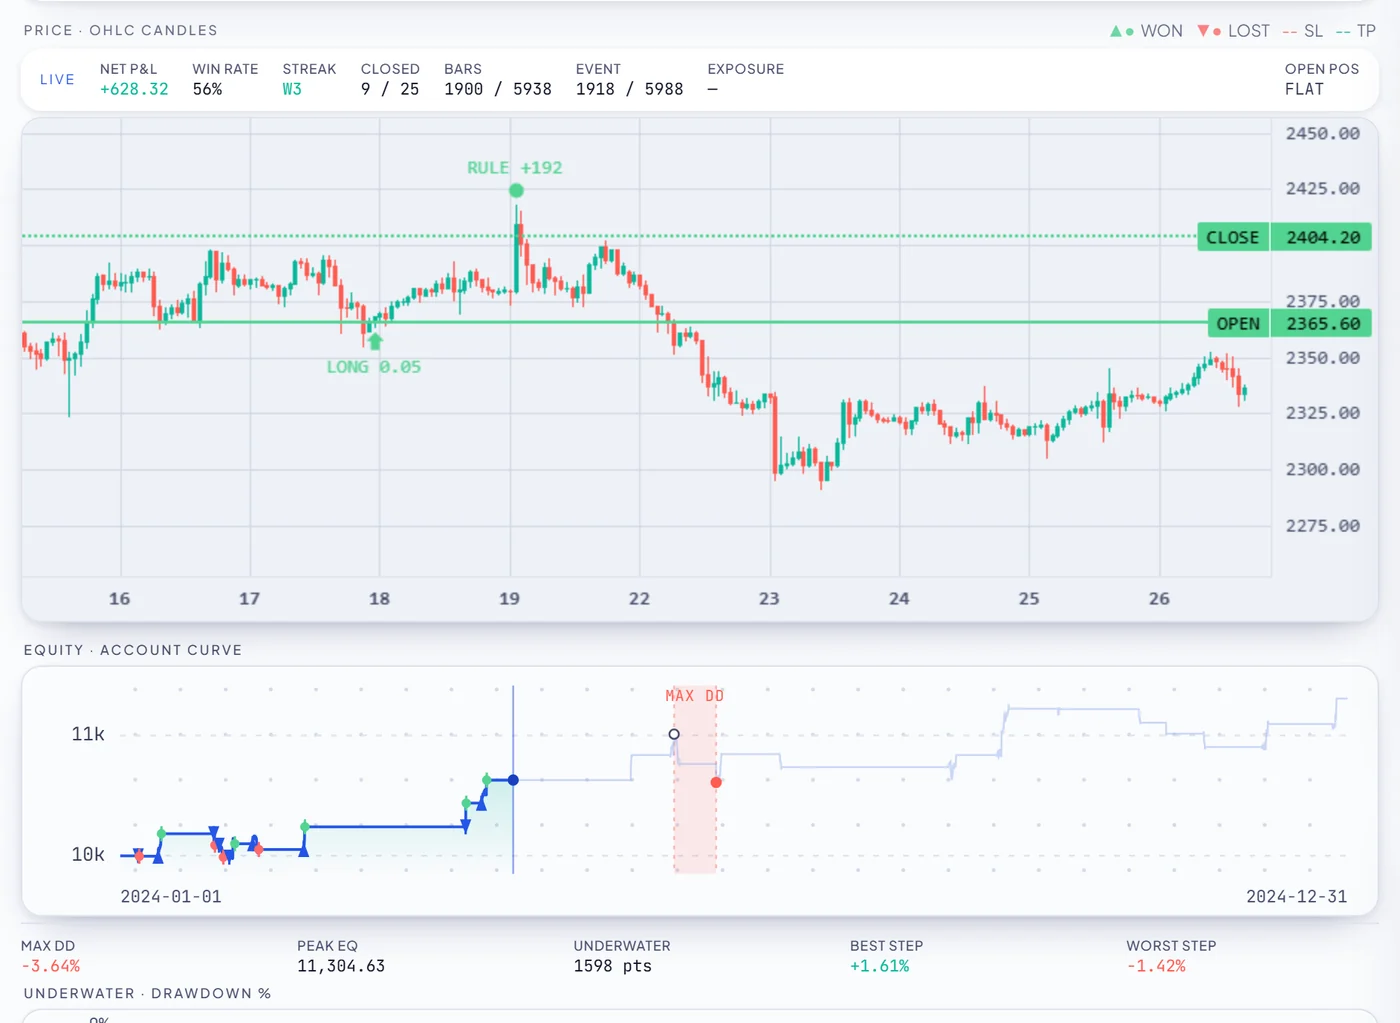
Every number above is computed from the six study artifacts in this repository, not typed in. The engine behind them has been run head-to-head against MetaTrader 5’s own Strategy Tester — the parity study — and here is how the workflow fits together.
Keep reading
Do forex robots actually work?
The population view: what a random robot does, what costs hide, and both selection holdouts.
Best EURUSD expert advisor
The walk-forward behind the hero chart: what happens to the top picks after they are picked.
Best GBPUSD expert advisor
215,727 gold strategies moved onto cable, and why gold's best did not transfer.
Best gold expert advisor for MT5
Nine years of XAUUSD with real spread, and what a high-return gold strategy really looks like.
Best timeframe for expert advisors
Why H4 beat M5 — and why it is a cost effect, not a skill effect.
Best forex pairs for expert advisors
All 25 instruments, what each charges a strategy, and why pair rankings do not travel.